• Acta Optica Sinica
  • Vol. 45, Issue 5, 0530003 (2025)
Yuanqing Wan1,2,3, Weijun Liu1,2,3, Haoxiang Yu1,2,3, and Shuming Wang1,2,3,*
Author Affiliations
  • 1National Laboratory of Solid State Microstructures, Nanjing University, Nanjing 210093, Jiangsu , China
  • 2School of Physics, Nanjing University, Nanjing 210093, Jiangsu , China
  • 3Collaborative Innovation Center for Advanced Microstructures, Nanjing University, Nanjing 210093, Jiangsu , China
  • show less
    DOI: 10.3788/AOS241737 Cite this Article Set citation alerts
    Yuanqing Wan, Weijun Liu, Haoxiang Yu, Shuming Wang. Infrared Wide‑Spectrum Miniature Spectrometer Based on Metasurface Spectral Encoding[J]. Acta Optica Sinica, 2025, 45(5): 0530003 Copy Citation Text show less
    Schematic diagram of spectral reconstruction based on spectral coding of metasurface. (a) Schematic diagram of spectral detection process; (b) MIM structure diagram (p is the period of unit structure); (c) fully connected neural network framework
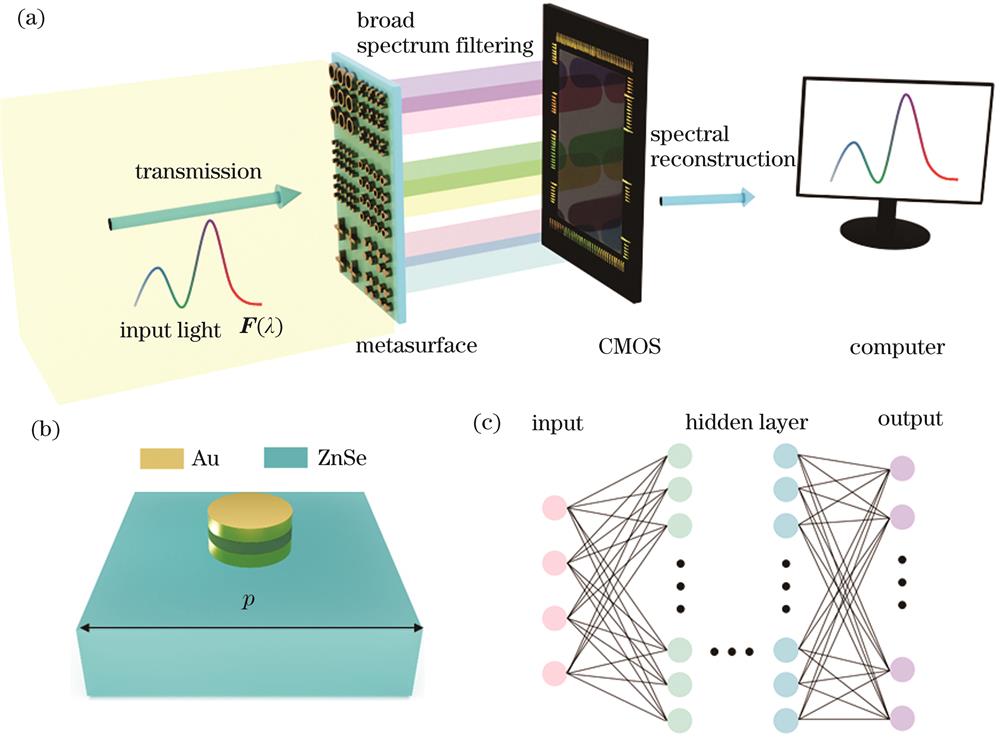
    Fig. 1. Schematic diagram of spectral reconstruction based on spectral coding of metasurface. (a) Schematic diagram of spectral detection process; (b) MIM structure diagram (p is the period of unit structure); (c) fully connected neural network framework
    Design results of the metasurface unit structure. (a) Schematic diagram of unit structure with four cylinders and spectral transmittance corresponding to different w and r values; (b) a pixelated unit structure diagram and spectral transmittance under TE light and TM light irradiation, and the red five-pointed star line is the transmittance curve of substrate ZnSe; (c) correlation coefficients between 530 spectral transmittance curves; (d) average value of 530 spectral transmittance curves, and the red line indicates the threshold of transmittance of 50%
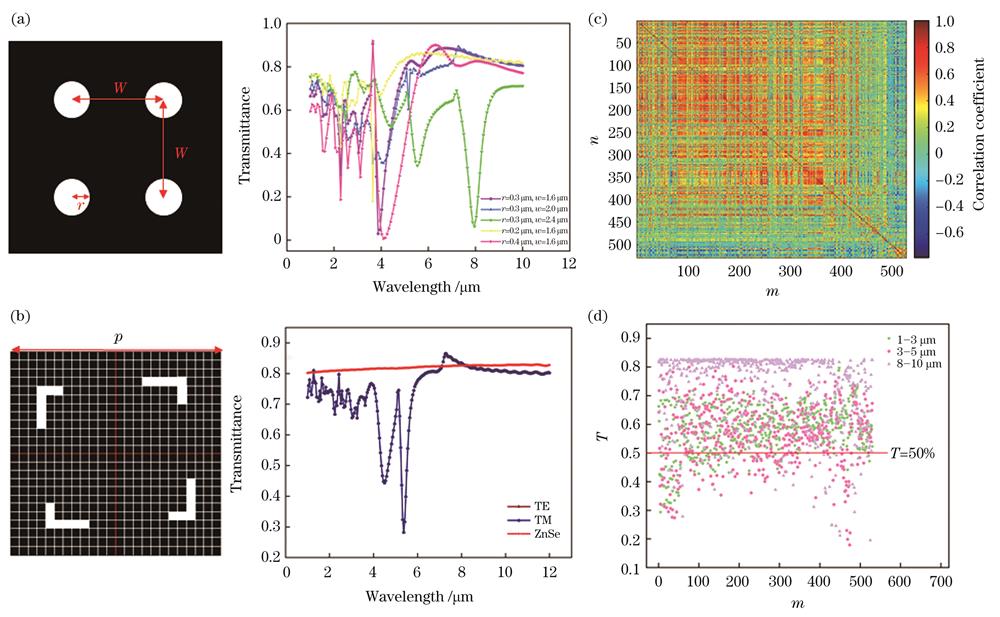
    Fig. 2. Design results of the metasurface unit structure. (a) Schematic diagram of unit structure with four cylinders and spectral transmittance corresponding to different w and r values; (b) a pixelated unit structure diagram and spectral transmittance under TE light and TM light irradiation, and the red five-pointed star line is the transmittance curve of substrate ZnSe; (c) correlation coefficients between 530 spectral transmittance curves; (d) average value of 530 spectral transmittance curves, and the red line indicates the threshold of transmittance of 50%
    Schematic diagrams of four selected channel structures and corresponding spectral transmittance curves. (a) Structure 1;
    Fig. 3. Schematic diagrams of four selected channel structures and corresponding spectral transmittance curves. (a) Structure 1;
    Reconstruction results of wideband spectra. (a) Example 1; (b) example 2; (c) example 3; (d) example 4
    Fig. 4. Reconstruction results of wideband spectra. (a) Example 1; (b) example 2; (c) example 3; (d) example 4
    Spectral curve reconstruction results with single peak. (a) Example 1; (b) example 2; (c) example 3; (d) example 4
    Fig. 5. Spectral curve reconstruction results with single peak. (a) Example 1; (b) example 2; (c) example 3; (d) example 4
    Yuanqing Wan, Weijun Liu, Haoxiang Yu, Shuming Wang. Infrared Wide‑Spectrum Miniature Spectrometer Based on Metasurface Spectral Encoding[J]. Acta Optica Sinica, 2025, 45(5): 0530003
    Download Citation