

As a critical technology for high spatial resolution and accurate polarization detection, the division of focal plane (DoFP) polarization detectors is achieved via the integration of micro-polarizer arrays (MPAs) with image sensors. These detectors are pivotal in numerous applications, ranging from remote sensing and biomedical imaging to military surveillance and industrial process monitoring. However, their potential is restricted by performance problems caused by crosstalk, which degrades the extinction ratio (ER) and reduces detection accuracy. Arising from both optical and electrical interactions, crosstalk negatively influences polarization measurement precision, thereby limiting the broader adoption of DoFP polarization detectors in high-performance systems. Despite their increasing importance, comprehensive analyses of crosstalk mechanisms and effective mitigation strategies remain insufficient. We aim to systematically investigate the origins and effects of crosstalk, analyze its influence on ER, and introduce an innovative solution to suppressing crosstalk by a novel optoelectronic isolation design. This approach addresses both optical and electrical crosstalks for enhancing the functionality and reliability of DoFP polarization detectors.
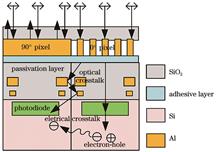
Key findings of our study include the following aspects. 1) Theoretical analysis. Our study starts with a systematic analysis of crosstalk mechanisms to identify contributing factors. Optical crosstalk is primarily caused by diffraction and reflection processes within the detector’s structural layers, and electrical crosstalk arising from charge diffusion across adjacent pixels is quantified and evaluated. Meanwhile, their collective effects on ER are modeled to highlight critical performance bottlenecks. 2) Numerical simulation. Simulations play a central role in validating the theoretical findings and exploring mitigation strategies. A front-side illuminated (FSI) dual-pixel DoFP detector model is developed and simulated by adopting the FDTD and CHARGE modules in Ansys Optics Launcher 2024 R1. The simulations focus on electromagnetic field distributions and charge transport phenomena, enabling accurate predictions of pixel-level crosstalk. By employing these tools, the ER is evaluated based on simulation-derived electrical parameters, which provides quantitative insights into the degradation mechanisms and tests of the proposed design concepts for mitigating crosstalk. 3) Experimental verification. MPA is directly fabricated on the photosensitive surface of a commercial CMOS image sensor (CMV4000) based on focused ion beam (FIB) technology. The detector contains 0°, 60°, and 120° polarization strips, which are composed of sub-wavelength Al gratings. Additionally, a line shape light source polarization testing system based on a cylindrical mirror is built to measure the polarization transmittance and quantify the crosstalk between pixels [Figs. 7(b) and 9].
Crosstalk mechanisms. Analysis reveals that optical crosstalk primarily originates from diffraction phenomena in the thick passivation layers and scattering by internal metallic structures, particularly the electrodes. In contrast, electrical crosstalk arises from carrier migration across pixel boundaries, significantly impairing ER. Finally, the undesired interference degrades ER. Fabrication and testing. The fabricated DoFP polarization detector demonstrates polarization transmittance curves with distinct sinusoidal characteristics. The measured crosstalk percentages for adjacent pixels reach as high as 19.26% (Table 2). Optoelectronic isolation design. To mitigate crosstalk, we propose a novel optoelectronic isolation strategy, which leverages Al conductors embedded within silicon dioxide insulators to block both photon migration and electron migration (Fig. 11). Simulations of this design demonstrate a substantial reduction in crosstalk, leading to significant ER improvements. Notably, the electrical ER reaches values that approach the intrinsic limits set by the MPA design itself (Fig. 12), thereby emphasizing the effectiveness of the proposed solution.
We systematically half-quantify the influence of crosstalk on the performance of DoFP polarization detectors and introduce a novel optoelectronic isolation strategy as an effective countermeasure. By combining theoretical modeling, numerical simulations, and experimental validation, we provide a comprehensive understanding of the mechanisms underlying optical and electrical crosstalks. The proposed design successfully suppresses both forms of interference, leading to significant enhancements in ER and overall detector performance. These findings provide both a valuable foundation for the design and development of high-performance DoFP polarization detectors and a reference for the integration of other array metasurfaces and planar array detectors. In the future, more complex detector models, real structures, and doping parameters will be adopted to quantitatively study the influence of photoelectric isolation.
.- Publication Date: Mar. 10, 2025
- Vol. 45, Issue 5, 0504001 (2025)

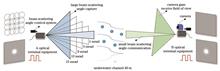
In long-distance underwater laser communication, the influence of optical attenuation limits the transmission efficiency of the link and expands the capture range, resulting in a decrease in optical power at the communication receiving end and a decrease in system performance. To achieve both fast chain building and stable communication, a new method has been proposed for optical composite transmission in beacon communication, which utilizes variable beam divergence angle control technology. The beam divergence angle control system controls the horizontal movement of the lens using a gear rotation focusing structure combined with a zoom motor. By changing the spacing between the optical lenses, the beam’s focal length can be adjusted to achieve precise control of the beam divergence angle. We analyze the optimization effect of variable beam divergence angle on underwater laser communication links from the perspectives of communication error rate and capture time. Underwater laser communication experiments are conducted in a swimming pool. Under the condition of water quality attenuation of 0.19 m-1, the communication distance is 40 m, and the capture time and communication error rate are measured. The actual capture time is 41.5 s, and the communication error rate is 3.62×10⁻⁶. Both simulation and experimental results indicate that the beam divergence angle control system can shorten the capture time to less than 60 s and reduce the bit error rate by two orders of magnitude compared to traditional systems.
To quickly build the link and stabilize the communication, we propose a new method for optical composite transmission technology in variable beam divergence beacon communication. The system is composed of a zoom motor, focusing structure, and lens. The beam divergence angle control system uses a gear rotation focusing structure and a zoom motor to control the horizontal movement of the lens. By changing the spacing of the optical lenses and thereby adjusting the beam focus, it achieves precise control of the beam divergence angle. A large beam divergence angle is used for rapid acquisition and chain building. The larger beam divergence angle helps to shorten the acquisition time. Scanning the uncertain area and capturing the signal must be completed within 60 s. Then, the beam divergence angle is gradually reduced. The process of changing the beam divergence angle from large to small primarily depends on the detection sensitivity of the communication detector and the link margin of the underwater channel. The narrow beam is used to effectively overcome the attenuation of water and achieve stable communication over a longer distance with high bandwidth, thereby improving the stability of the communication link, as verified by simulation and experiment.
According to the simulation results, when using the traditional underwater wireless optical communication (UWOC) system with a fixed beam divergence angle, to meet the high bit error rate (less than 1×10⁻³) requirements of space optical communication for data integrity, the system needs a minimum beam divergence angle of 8 mrad. Under these conditions, the acquisition and chain-building time is 133.5 s. Generally, as communication performance improves (i.e., the bit error rate decreases), the beam divergence angle will decrease, but the acquisition and chain-building time will increase (Figs. 4 and 6). However, in the case of beam divergence angle control, as shown in Table 2, when using a large angle for acquisition, the chain-building time is 38.4 s, after which the system switches to a small angle for communication. At this point, the communication bit error rate is 8.32×10⁻⁶. Therefore, in the case of the optimized UWOC system with beam divergence angle regulation, the acquisition and chain-building time is reduced by 95.1 s, and the communication performance improves by two orders of magnitude, while still meeting the communication index requirements. This leads to further improvement in the performance of the UWOC system.
To solve the contradiction between fast chain-building and stable communication in the UWOC system, we propose a transmission technology using communication light and beacon light with a variable beam divergence angle. Through theoretical simulation, the effect of changes is studied in beam divergence angle on capture time and communication performance. The simulation results show that when the bit error rate is less than 1×10⁻³, compared with the traditional UWOC system, the optimized beam divergence angle control UWOC system reduces the acquisition and chain-building time by 95.1 s and the communication bit error rate by two orders of magnitude. Through a 40 m pool experiment, it is verified that the acquisition and chain-building time is 41.5 s, and underwater transmission with a bit error rate of about 3.62×10⁻⁶ at 40 m and 1 Mbit/s is successfully realized, which is consistent with the simulation results. The experimental results show that, compared with the traditional system, the optimized beam divergence angle control system can reduce the capture time to less than 60 s and significantly reduce the bit error rate by two orders of magnitude. In conclusion, this technology can lay a theoretical foundation for the application of dynamic long-distance underwater laser communication.
.- Publication Date: Mar. 17, 2025
- Vol. 45, Issue 5, 0506001 (2025)
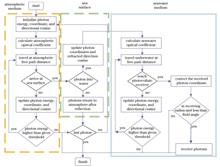
The restricted power supply problem for equipment both on and below the sea surface has seriously affected the development of marine equipment, as well as the exploration and exploitation of marine resources. Traditional power supply methods, such as cable and resonant power supplies, come with several challenges, including limited transmission distance, complex equipment, and high costs. In contrast, laser wireless power transmission, with its advantages such as high power density and small equipment size, holds broad application prospects. However, most studies on laser transmission characteristics focus on the behavior of lasers in a single medium, and further research is needed for the successful realization of practical scenarios where airborne lasers supply power to devices on and below the sea surface. In this study, we use the Monte Carlo method to simulate and analyze the transmission characteristics of lasers in multi-medium coupling links and investigate the characteristics of lasers during cross-medium transmission. We hope that our research results and strategies will provide theoretical references for the design and implementation of cross-medium laser wireless energy transmission systems.
Firstly, this study analyzes the optical characteristics of different transmission media, including the atmospheric medium, air?sea interface, and seawater medium, and models the optical coefficients of each transmission medium using relevant theories and mathematical models. Secondly, based on the medium models established by these theories and mathematical models, the Monte Carlo method is employed to simulate the entire physical process of a large number of photons transmitting through the media, obtaining statistical results that closely approximate the actual situation.
We analyze the relationships among transmission media, optical coefficients, and important indicators of the laser energy transmission system through simulation. In the atmospheric transmission medium, as the particle radius increases, the atmospheric optical coefficient gradually increases. Moreover, there is no obvious correlation between the total extinction coefficient and the complex refractive index, but the scattering coefficient and the absorption coefficient are positively correlated with the real and imaginary parts of the complex refractive index, respectively (Fig. 2). When the laser wavelength varies within the range of 400?700 nm, the scattering coefficient of the seawater medium gradually decreases as the wavelength increases, while the extinction coefficient first decreases and then increases. In addition, the optical coefficients of seawater increase with the mass concentration of phytoplankton or non-pigment suspended particles (Fig. 3). This study provides a basis for the selection of laser wavelengths in different media. Lasers with a wavelength of 720 nm have a relatively large optical coefficient in the atmosphere and will experience greater scattering losses in the seawater medium. Blue light with a wavelength of 450 nm and green light with a wavelength of 500 nm are more suitable for use in the seawater medium (Fig. 4). We also use the Monte Carlo method to conduct a qualitative analysis of photon transmission characteristics, including photon transmission trajectories (Fig. 5) and the energy flow distribution of successfully received photons (Fig. 6). Through quantitative analysis, it is found that the normalized received power decreases as the transmission distance increases (Fig. 8). The increase in wind speed reduces photon transmittance and the degree of spot expansion without significantly affecting the laser normalized received power (Fig. 9). The normalized received power changes with the increased beam waist radius when using nonconstant asymmetry factors, but an increase in the receiving radius will increase the normalized received power to a certain extent (Fig. 10).
Based on the Monte Carlo method, we focus on the influence of relevant factors, such as suspended particles and wind speed at the air?sea interface, on laser transmission characteristics throughout the entire process—from the atmosphere to the air?sea interface and into the seawater. The research results show that when lasers are transmitted through the atmosphere, the optical coefficient increases with the size of atmospheric aerosol particles. Additionally, the scattering coefficient increases with the real part of the complex refractive index, and the absorption coefficient increases with the imaginary part of the complex refractive index. When lasers are transmitted in water, the optical coefficient increases with the mass concentration of phytoplankton and non-pigment suspended particles. The extinction coefficients of blue?green lasers are smaller, and the extinction coefficient reaches a minimum when the wavelength is 570 nm. The normalized received power decreases with increasing transmission distance, with this decrease being more pronounced in the underwater environment. The extinction coefficients of lasers in the blue?green and near-infrared bands are relatively low, which results in higher transmission efficiency. Both photon transmittance and the deflection angle of the photon transmission direction decrease as wind speed at the air?sea interface increases. These changes exhibit an opposite trend compared to that of the normalized received power, leading to a minimal impact of wind speed on the normalized received power. When the asymmetry factor is constant, the trend of normalized received power is not significant for the laser beam waist radius. However, with nonconstant asymmetry factors, the trend becomes more noticeable. The normalized received power increases substantially with the radius of the receiver. These findings offer a theoretical reference for the realization of airborne laser cross-medium downlink wireless energy transmission.
.- Publication Date: Mar. 26, 2025
- Vol. 45, Issue 5, 0506002 (2025)
The augmented reality head-up display (AR-HUD) can integrate with real-world road conditions, projecting rich driving information into the driver’s field of vision as images or text, significantly improving driving safety and user experience. To better incorporate AR, the AR-HUD system has evolved from a single-focal-plane display to a multi-focal-plane display, which has increased the complexity of optimization design. The traditional trial-and-error method requires substantial man power and time, and the final optimization direction and design results often depend heavily on the designer’s experience. Therefore, it is necessary to develop a simple and effective method for the automatic construction and optimization of bifocal or multi-focal plane AR-HUD systems, ensuring the ability to simultaneously display near-field basic information and far-field interactive information.
The initial structure of an off-axis three-mirror system is typically derived from the coaxial three-mirror system, but the final structure often shows significant deviations, and the intermediate construction process is time-consuming. In this paper, the windshield point cloud is first represented by XY polynomials. The full field of view is then tracked, and characteristic rays within the pupil are sampled. Point cloud envelope information is computed using Malus’ law and the law of refraction. The field of view expansion is solved step-by-step, ensuring contiguity across adjacent fields. Data fitting is constructed using smooth spline polynomial (SSP) characterization to construct the initial architecture. The edge field of view data is further optimized using iterative optical feedback, with iterative coefficients adjusted during the process. The root-mean-square error is evaluated based on the imaging performance quality function, and the optimal fitting coefficients are determined. The desired free-form mirror is then iteratively generated, resulting in the final structure of the bifocal-plane AR-HUD optical system.
As an example, a bifocal-plane AR-HUD system is designed with a far-field virtual image distance (VID) of 10 m for a 12°×3.5° field of view and a near-field VID of 3.8 m for a 6°×2° field of view. The eye box size is 130 mm×50 mm. The real automotive windshield point cloud is extracted and represented by XY polynomial fitting. At the same time, an initial system with two unshielded inclined and eccentric planes is established. During construction, the center field of view and the edge field of view are first defined, and point cloud locations are calculated using Malus’ law. The coordinate envelope information of the point cloud in the full field of view is derived using a field-of-view extension method and fitted to a third-order XY polynomial form (Fig. 11). The validity of the optical path feedback iteration method is verified, and after 15 iterations, the average spot radius is reduced by 61.73% compared to the initial configuration (Fig. 11). Finally, after ensuring that the boundary conditions for continuity are met, a sixth-order free-form surface characterized by SSP is compared with a sixth-order XY polynomial primary mirror for image quality optimization. At a reference wavelength of 0.587 μm, the wavefront RMS of the far-field surface is reduced by 26% (Fig. 12). The edge field-of-view performance also improved, with the modulation transfer function (MTF) of the SSP design approaching diffraction limits. At 6.5 lp/mm, the MTF is greater than 0.5, representing a 10% improvement compared to the traditional XY polynomial expression. The distortion in the SSP design is also well-controlled (Fig. 12).
The algorithm framework proposed in this paper enables the rapid generation of a stable initial bifocal-plane AR-HUD architecture for a single optical machine in limited space. It further optimizes system image quality to meet AR-HUD performance requirements at varying projection distances. This method effectively improves the iteration efficiency of freeform surface systems, reaching the threshold value after only a few iterations. It also considers the fusion of adjacent freeform surface. The comprehensive characterization using SSP enhances the optimization efficiency for designers. The bifocal-plane AR-HUD design example verifies the feasibility and practicality of this algorithm. The resulting image quality meets application requirements and provides a valuable reference for the future development of multi-focal-plane AR-HUD systems. This method can also be effectively applied to other freeform surface imaging systems, such as ultra-short focus projection systems, and head-mounted display system.
.- Publication Date: Mar. 04, 2025
- Vol. 45, Issue 5, 0511001 (2025)

Augmented reality head-up displays (AR-HUDs) are mainly categorized into single optical path HUDs and dual optical path HUDs. Compared to single optical path HUDs, dual optical path HUDs have received significant attention due to their capability to separately display basic driving information and real-time navigation data. However, existing dual optical path HUDs often use orthogonal projection for presenting real-time navigation information, which may result in insufficient augmented reality effects and visual fatigue for drivers due to frequent recognition of road conditions. To address these challenges, we propose a novel dual optical path HUD structure to present more effective information to drivers while reducing costs and saving space. The system demonstrates excellent display performance in real-time navigation information presentation.
To minimize costs and save space, our system uses a single picture generation unit (PGU) to achieve dual optical path displays for both near and far fields. To enhance the augmented reality effects of real-time navigation information in the far field, the far optical path adopts oblique projection, achieving seamless ground fusion of navigation data. Based on geometric optics imaging principles, the system leverages the relationship between object distances and virtual image positions. The initial structure of the automotive head-up display system using dual optical path oblique projection in our study is designed based on this principle. Specifically, an optical wedge is introduced between the primary reflector and the PGU to achieve a small angular deflection in the near optical path. This alters the optical length of the near optical path, allowing the light emitted by the PGU to produce two virtual images at different distances in front of the driver after multiple reflections. Light from the PGU passes through a primary mirror, a secondary mirror, and a windshield before entering the human eye. Finally, it converges into two virtual images, far and near images, at different distances in front of the windshield. The near field uses orthogonal projection, while the far field uses oblique projection.
Our system integrates two separate areas on a single PGU. An optical wedge relays one area to a closer position, enabling dual optical path displays for both near and far fields. Imaging quality analysis shows that when the driver’s eye is positioned at the center of the eye box, the system’s dot spots remain within the Airy disk across the entire field of view. The maximum RMS spot radii for near and far optical paths are 21.636 and 26.210 μm, respectively, significantly smaller than their corresponding Airy disk radii. The minimum MTF values at the cut-off frequency are 0.586 and 0.524 for the far and near optical paths, respectively, both exceeding 0.5, with grid distortion under 5%, meeting the design requirements. UI simulations demonstrate minimal distortion in the effective area at the center of the UI both before and after the near optical path simulation. The UI image corresponding to the far optical path is clear and exhibits a trapezoidal effect, aligning with the driver’s visual characteristics during driving and effectively displaying relevant driving information.
In this paper, we propose an automotive HUD using dual optical path oblique projection. By introducing an optical wedge between the PGU and the primary mirror, the optical length of the near optical path is altered, enabling simultaneous dual image plane displays for both far and near fields. The near optical path adopts orthogonal projection to display basic driving information, while the far optical path adopts oblique projection for real-time navigation information fusion display on the ground. The design reduces the driver’s visual burden, enhances the visual experience, and delivers an AR-HUD with virtual image distances of 5 m (corresponding to a field of view angle of 10°×1°) and 6.5?8.5 m (corresponding to a field of view angle of 10°×2°). The system achieves excellent imaging quality and meets the modern processing level, providing a reference for the future development of automotive HUDs.
.- Publication Date: Mar. 21, 2025
- Vol. 45, Issue 5, 0511002 (2025)

As a strategic focus in the military field of various countries worldwide, hypersonic remote sensor technology highlights irreplaceable advantages in performing tasks such as long-range strikes, reconnaissance, monitoring, and rapid response. However, as flight speed increases, the environmental conditions faced by the aircraft become more extreme. Among them, the optical window, a key component of the hypersonic remote sensor, is usually installed on the bottom skin of the aircraft. It serves not only to isolate the external harsh environment but also to ensure that the internal photoelectric load operates in a relatively stable environment. Additionally, it acts as the optical imaging channel that connects the internal photoelectric load with the external environment and is directly involved in imaging, which significantly affects its dynamic imaging performance. More and more scholars are focusing on the impact of multi-physical field coupling on the performance of optical windows. The technical characteristics and application scope of optical windows currently under study are primarily focused on subsonic and supersonic aircraft platforms. However, there is limited public information in recent research on the dynamic imaging performance of optical windows in hypersonic aircraft. Therefore, conducting research on the dynamic imaging performance of hypersonic optical windows, especially through multi-physical field coupling analysis, will help deeply understand the changing dynamics of their performance. This research will provide theoretical support for the design and optimization of optoelectronic payloads and further promote the application of these payloads in hypersonic aircraft.
We propose a multi-physics coupling numerical calculation method that integrates the multidisciplinary fields of flow, heat, structure, and optics to analyze the dynamic imaging performance of optical windows in hypersonic flight environments. This method combines computational fluid dynamics (CFD), finite element analysis (FEA), and optical transmission models to systematically study the influence of thermal effects, aerodynamic pressure, and structural response of optical windows on imaging performance under hypersonic flight conditions. First, the CFD method is used to simulate the flow field of the hypersonic vehicle, the aerodynamic environment of the vehicle surface, and the optical window, obtaining thermal flow and aerodynamic pressure data for the window surface. Then, based on the CFD analysis results, FEA is employed to perform thermal-structural coupling analysis to determine the window surface temperature field. The window deformation caused by the temperature gradient is simulated by combining the thermal expansion characteristics and structural response of the material. Finally, the influence of window surface changes on the light field difference, transmission wave aberration, and imaging performance is analyzed using an optical-mechanical-thermal integration analysis method.
In our study, a multi-physics field coupling numerical calculation method, integrating the multidisciplinary fields of flow, heat, structure, and optics, is proposed to address the complexity of dynamic imaging performance of optical windows in hypersonic environments. First, an aero-thermal-aerodynamic pressure-stress field coupling model is established to obtain the temperature, aerodynamic load distribution, and structural response of the window components under high Mach number flight conditions. Second, an opto-mechanical-thermal integration simulation model of the window components is established to evaluate the transmission wavefront performance (Fig. 10) of the optical window after disturbance. Finally, by combining with the actual optical system model, the law of change is revealed in the dynamic imaging performance of the optical window under hypersonic flight conditions. The results show that, with the increase in flight speed, the temperature of the optical window increases significantly, which leads to a substantial decrease in the optical performance of the optical window assembly (Fig. 11). The modulation transfer function (MTF) decreases by 0.194 (@100 cycle/mm), and the imaging quality of the optical system after focusing (Fig. 12) has an MTF larger than 0.187 (@100 cycle/mm). Through the multi-physics field coupling method proposed in this paper, the performance changes of optical windows under high Mach number flight conditions are predicted more comprehensively and accurately, which breaks through the limitations of single physical field analysis and provides a theoretical basis for the optimization of optical window design.
We study the actual flight environment of the aircraft for the optical window assembly carried by the hypersonic remote sensor, establish an aerodynamic-thermal finite element model for the aircraft, and obtain the aerodynamic heating heat flux density on the window surface in a flight cycle. The optical-mechanical-thermal multi-physics field coupling analysis is conducted on the window component, which reveals that the highest temperature of the window surface reaches about 792 ℃, and the window glass component experiences a non-uniform temperature field distribution. The temperature field is then interpolated into the structural model, and the deformation displacement of the window surface is obtained, causing the flat window glass to transform into a curved surface due to the non-uniform temperature field. Finally, based on optical-mechanical interface technology, the window component is thermally evaluated, and the imaging performance is analyzed. The transmission wave aberration root mean square (RMS) is <0.2903λ (λ=632.8 nm), and the imaging quality MTF of the optical system after focusing is larger than 0.187 (@100 cycle/mm), which meets the performance index requirements of the remote sensor. The multi-physics field coupling method proposed in this paper provides a theoretical basis for the design and optimization of optical windows and lays a foundation for engineering applications in related fields.
.- Publication Date: Mar. 21, 2025
- Vol. 45, Issue 5, 0511003 (2025)
In recent years, with advancements in cold atom physics and relevant experimental techniques, cold atom interferometry has emerged as an important tool, finding widespread applications in precision measurements and fundamental physics research. Research on high-precision and portable atomic interferometers has become very popular. In precision measurement experiments, the system miniaturization requires the downsizing of the vacuum chamber. A vertical fluorescence scheme for different atomic ground states can cancel the additional detection zones in traditional parallel detection schemes and achieve miniaturization of the vacuum chamber for the interferometers. This detection scheme is based on the sequence detection of atoms in distinctive states, where the atoms absorb energy from the detection beams, resulting in atomic temperature increase and subsequently detection efficiency decrease. Otherwise, the detection noise and the signal-to-noise ratio (SNR) should be evaluated to improve measurement precision. We hope that our scheme can optimize SNR and reduce the main detection noise.
Our study is based on sequence fluorescence detection, and the noise sources include the shot noise, the circuit noise, the intensity, and the frequency noise of the detection beams. Compared to traditional parallel detection schemes, the vertical detection scheme is greatly affected by shot noise. In this scheme, the atoms in the F=2 state and the total atoms are detected sequentially. The proportion of F=2 atoms in the total number of atoms is employed to represent the signal. This method is called normalized detection, whose application can reduce the shot noise in the signal. Furthermore, based on theoretical analysis, adjusting various parameters of the detection beams can minimize the detection shot noise, thereby optimizing SNR. Specifically, the atoms absorb energy from the detection beams, causing atomic temperature increase and subsequently detection efficiency degradation. Additionally, due to the presence of detuning in the detection beams, the sequence detection may result in the occurrence of non-closed transitions, which enhances the shot noise during the detection process. Our study evaluates the influence of detection beam frequency and duration.
The scan of the detection frequency after the first detection pulse is applied is shown in Fig. 2. With the detection time extended to 0.5 ms, the resonance spectrum obtained from the scan splits from a Gaussian-type resonance peak into two distinct peaks. An additional sideband can be observed as the vertically polarized vertical detection beams interact with the atoms, forming 1D molasses. Additionally, the resonance frequency shifts approximately 2 MHz compared to the resonance frequency during 0.5 ms detection duration. This requires shortening the duration of the detection beams to optimize the signal. On the other side, for the detection process, the fluctuation in the number of atoms falling into the dark state is also a major shot noise source. The influence of such fluctuations on the SNR can be assessed by theoretical calculations. When the detection duration is longer than the minimum detection duration, an optimized SNR is achieved. In the experiment, the standard deviation of detection is measured, and an optimal range of detection duration exists. Additionally, conducting detection within this range can achieve optimized detection results.
Generally, we provide a basic framework for a vertical detection scheme, utilizing fluorescence detection with detection beams in the vertical direction. Traditional detection schemes require two horizontal probe beams, necessitating additional areas and windows within the vacuum chamber for state detection of atoms, which is not conducive to the miniaturization of the atomic interferometer system as a whole. By adopting this vertical scheme, we successfully reduce the volume of the vacuum chamber and eliminate the extra detection areas provided by traditional horizontal detection schemes. We optimize the detection sequence, shorten the detection time, and achieve a normalized standard deviation of 0.014. Furthermore, our study measures the ratio of atoms participating in the cyclic transition in the experiment, and the SNR calculation helps us estimate the noise caused by non-closed transitions during the detection. Under the application of sequential detection in the experiment, fluctuations in the SNR are observed when the laser intensity, frequency, and duration change due to the loss caused by atoms participating in non-closed transitions. In this case, the optimal combination of the atomic cycling rate and detection time obtained via analysis reduces shot noise and optimizes the measurement precision. Additionally, eliminating extra noise such as circuit noise and noise caused by changes in the intensity and frequency of the probe beams can enhance the SNR. In future work, we will focus on further improving this detection scheme and exploring its applications in advanced cold atom experiments.
.- Publication Date: Mar. 21, 2025
- Vol. 45, Issue 5, 0512001 (2025)
Cavity ring-down spectroscopy (CRDS) is a laser spectroscopy used to measure the decay time of light in an absorbing medium. Owing to its advantages of high precision, high sensitivity, immunity to light intensity fluctuations, and rapid response, it has been widely applied in fields such as greenhouse gas monitoring, aerosol extinction detection, low-loss mirror reflectivity measurement, and analysis of semiconductor material properties. During the detection process, due to the weak intensity of the output light, amplification of the detection signal is necessitated. However, the gain-bandwidth product of the detection system remains constant, resulting in a corresponding reduction in the system’s bandwidth as the amplification factor increases. When the bandwidth is excessively narrow, it can induce distortions in the detected decay curve, reducing the accuracy of ring-down time measurements. To address this issue, this study proposes a cavity decay curve restoration method based on Wiener deconvolution transformation. By using the detector system’s transfer function to restore the decay curve, this method reduces the impact of high-frequency noise on the deconvolution, effectively enhancing the measurement accuracy of cavity ring-down spectroscopy.
The distorted decay curve is restored using Wiener deconvolution. First, the step response curve of the detector is measured to identify the transfer function of the detector system. Subsequently, the decay signal is measured using the cavity ring-down spectrometer, during which the detected signal is distorted compared to the original signal due to the influence of the detector’s response. To facilitate computation, the measured signal is subjected to a Fourier transform, converting the decay curve into a frequency-domain signal. This frequency-domain signal contains the spectrum of the decay curve modulated by the detector system’s transfer function, as well as the noise spectrum. To reduce the impact of high-frequency noise on the deconvolution and accurately restore the decay curve spectrum, Wiener filtering is applied to the frequency-domain signal based on the transfer function of the detector system, resulting in a restored frequency-domain signal. The restored frequency-domain signal is then transformed back into the time-domain using an inverse Fourier transform, yielding a corrected signal closer to a single-exponential decay. Finally, a single-exponential fit is performed to obtain the corrected ring-down time.
To validate the efectiveness of the proposed method, simulations and experiments were conducted. In the simulations, the responses of first-order systems with three different bandwidths to the decay curves were first simulated, as shown in Fig. 2. As the detector bandwidth narrowed, the distortion of the measured decay curves increased, and the measured decay time became longer. Subsequently, simulations were performed to investigate the effect of detector bandwidth on gas concentration measurements. Using the CO2 absorption spectrum from the HITRAN database, the impacts of different bandwidths on the absorption spectrum measurement were simulated, with the results shown in Fig. 3. As the detector bandwidth narrowed, the measured spectral area decreased, resulting in lower measured gas concentrations. Next, with the detector bandwidth set to 1 MHz, the effects of different ring-down time on the decay curve were simulated (Fig. 5). The results indicate that shorter ring-down time is more significantly affected by the detector bandwidth. Wiener deconvolution was then applied to restore signals with three different ring-down time. The restoration reduced the measurement error of ring-down time to lower than 1/20 of uncorrected result, demonstrating that this method effectively mitigates the influence of detector bandwidth in the simulations. For experimental validation, a frequency-swept continuous-wave cavity ring-down spectroscopy system was constructed to measure decay curves and absorption spectrum. In the experiments, the step response function of the detector was first measured to determine its system transfer function (Fig. 7). The Wiener deconvolution method was then applied to correct the measured cavity ring-down time and the reference CO2 spectrum (Fig. 13). Experimental results show that the measurement error of the reference CO2 concentration was reduced to within the nominal range of the reference gas. These results indicate that the deconvolution method effectively corrects decay curve distortions caused by detector responses, thereby improving the measurement accuracy of the cavity ring-down spectroscopy system.
We introduced a ring-down time measurement correction method based on Wiener deconvolution. This method effectively enhances the accuracy of cavity ring-down spectroscopy (CRDS) measurements. Compared to using a broad-bandwidth detection system, this method allows for higher measurement accuracy with a low-cost, narrow-bandwidth system, thereby contributing to a reduction in instrumentation costs. The restoration performance of simulated decay curves demonstrate that for decay curves affected by a 1 MHz bandwidth detector, this method reduced the measurement error of ring-down time to lower than 1/20 of uncorrected result, with the fitting residuals stabilized below 0.009. These results indicate that the method effectively mitigates distortion in the decay curves and restores their original profiles. In the experimental measurement of reference CO2, the method accurately restored the decay curves and the absorption spectrum. Consequently, the concentration measurement error decreased from 4.99% to 0.25%, well within the nominal uncertainty of ±1%. This demonstrates that the proposed method meets the accuracy requirements of CRDS for precise measurements.
.- Publication Date: Mar. 21, 2025
- Vol. 45, Issue 5, 0512002 (2025)
Large-size ultra-smooth mirrors remain essential for focusing and deflecting X-rays. As the demand for higher mirror surface accuracy increases in advanced light sources, such as hard X-ray free electron laser facilities, optical metrology with precision in the range of a few nanometers for peak-to-valley (PV) and sub-nanometer root mean square (RMS) values is required. Commonly used techniques include the long trace profiler (LTP) and the nanometer optical component measuring machine (NOM), both of which measure surface slope and derive height through mathematical conversion. In addition, the Fizeau interferometer combined with stitching is widely used for 2D surface height measurements. However, X-ray mirrors, such as elliptical cylinders, parabolic cylinders, and cylindrical surfaces, present challenges due to the limited accuracy imposed by reference mirrors in Fizeau interferometry. To address this, we employ highly precise displacement sensors with picometer-level resolution and sub-millimeter spot size. In this paper, we report a three-sensor measurement system that demonstrates repeatable nanometer-level accuracy, showing its effectiveness in X-ray mirror surface metrology.
The system consists of three displacement sensors, a scanning stage, and two mirrors. The sensors are mounted on an aluminum alloy beam, which is rigidly connected to the scanning stage. This configuration ensures that the sensors and stage move as a rigid body. One sensor measures the surface under test (SUT), while the other two measure the reference mirror surface (REF) to compensate for motion errors from the scanning stage. Sensor measurements include not only the mirror surface height but also motion errors from the stage. These errors are categorized as straightness errors and angular errors. Straightness errors affect all three sensors equally, while angular errors cause varying displacements among them. According to Euler’s theorem, the displacement caused by angular errors can be derived by analyzing the angles in the x, y, and z directions. A linear relationship exists between the displacements caused by angular errors in the three sensors. Thus, the surface height can be determined by compensating for the motion errors using this linear relationship.
The results of single-point measurements show an average PV of 10 nm and an average standard deviation (STD) of 2 nm within 1 h (Fig. 6), indicating the feasibility of using interferometric displacement sensors for surface shape measurement. The correlation analysis between temperature and displacement shows a negligible effect (Figs. 7 and 8), indicating that temperature fluctuations can be disregarded. The surface profile of the mirror is measured (Fig. 9), with five repeated measurements conducted to evaluate repeatability. The average standard deviation of the difference between individual measurements and their mean is 2.69 nm, demonstrating excellent repeatability. The results closely match those obtained with the Fizeau interferometer, demonstrating a correlation coefficient of 0.804 and validating the accuracy of the three-sensor system (Fig. 10).
In this paper, we propose a three-sensor displacement measurement system integrated with a scanning stage for accurate mirror surface profiling. Theoretical analysis demonstrates that there is a linear relationship between the displacements due to stage angular errors, which can be effectively compensated. Single-point measurements show the system’s capability, while temperature tests verify that environmental factors have minimal influence. The system demonstrates a repeatability of 2.69 nm in measurements and shows high agreement with Fizeau interferometer results. Our findings demonstrate that the system effectively compensates for motion error and reliably measures mirror surfaces with nanometer-level precision. In conclusion, the three-sensor measurement system shows great promise for measuring high-precision mirror surfaces. In future research, we aim to further enhance the accuracy of these measurements.
.- Publication Date: Mar. 26, 2025
- Vol. 45, Issue 5, 0512003 (2025)
Object pose estimation is widely applied in fields such as robot grasping, augmented reality, and autonomous navigation. However, complex and unstructured environments present significant challenges, such as scattered stacking and mutual occlusion of objects, complicating the accurate 6D pose estimation of target objects. Traditional point cloud-based pose estimation methods typically determine the optimal transformation matrix between two point clouds. In real-world scenarios, stacked objects often have simple structures and lack distinctive features, making it difficult to accurately extract corresponding points. As a result, traditional methods are generally limited to single-target pose estimation and struggle to address multi-instance, multi-target pose estimation, where the model point cloud must align with multiple instances in the target scene. This is further complicated by the unknown number of instances and occlusion between them.
In this paper, we introduce a multi-instance point cloud pose estimation method leveraging a Gaussian-weighted voting strategy. To address the challenges of occlusions and the lack of distinctive features in stacked workpieces, which often result in biased voting and inaccurate corresponding points, we propose a Gaussian-weighted voting approach for generating corresponding points. Initially, the point pair features of the model point cloud are extracted. The angular distribution between point pair normal vectors is Gaussian-fitted to calculate weight coefficients, enabling more accurate voting based on the angular relationships between normal vectors. This results in a refined set of corresponding points and an initial pose estimation set. To achieve multi-instance pose estimation, we introduce a clustering and optimization method based on distance invariance. A distance invariance matrix is constructed from the corresponding point set, and feature vector similarities are calculated to efficiently cluster multiple instances. Redundant poses are filtered out through refined clustering centered around the instances, while incorrect poses are eliminated by evaluating point cloud overlap. Final pose optimization is performed using the iterative closest point (ICP) algorithm.
To evaluate the proposed method’s effectiveness, both simulation and real-world robotic sorting experiments are conducted. In simulation tests, mean recall (MR), mean precision (MP) and mean F1 score (MF) serve as evaluation metrics. On the Romain dataset, the Gaussian-weighted voting strategy improves the accuracy of corresponding points and the initial pose set. Compared to the PPF method, the proposed approach reduces the average rotation error (RE) by 1.58° and translation error (TE) by 0.55 mm (Table 1). For multi-instance pose estimation on the Romain and ROBI datasets, the proposed method achieves MF of 16.56 percentage points (Fig. 9, Table 2) and 15.39 percentage points (Fig. 11, Table 3) higher than the best comparison methods, respectively. Real-world tests show RMSE values within 3 mm, with a minimum of 1.13 mm. Average MR, MP, and MF values are 61.07%, 68.97%, and 64.57%, respectively (Fig. 13, Table 4). Robotic sorting experiments achieve a 93% success rate, significantly outperforming the 60% success rate of the point pair feature (PPF) algorithm (Fig. 12, Table 5).
In this paper, we address the challenges of pose estimation errors caused by object occlusion and simple features in stacked scenes by proposing a multi-instance point cloud pose estimation method based on a Gaussian-weighted voting strategy. To address biased voting caused by simple workpiece features, the angular distribution between normal vectors of point pairs is Gaussian-fitted to refine the voting process, improving the accuracy of corresponding points and the initial pose estimation set. To enable multi-instance point cloud pose estimation and distinguish correspondences between different instances, a distance invariance matrix is constructed to efficiently cluster multiple instances. Redundant poses are filtered through refined clustering centered on instance points, while incorrect poses are eliminated through screening based on the point cloud overlap rate. Final pose optimization is achieved using the ICP algorithm. Simulation and robotic arm sorting experiments demonstrate the robustness and effectiveness of the proposed method in managing multi-instance recognition and pose estimation in stacked scenes. The approach shows significant potential for application in robotic arm automatic sorting systems within unstructured stacking environments.
.- Publication Date: Mar. 24, 2025
- Vol. 45, Issue 5, 0515001 (2025)
Known for its high efficiency, accuracy, and robustness, the binocular multi-line laser (BMLL) three-dimensional (3D) reconstruction system has significant applications in fields such as industrial inspection, reverse engineering, and cultural heritage preservation. However, when multiple laser planes are projected onto the surface of 3D objects with substantial geometric variations, the modulations caused by the object often result in irregular discontinuities, overlaps, distortions, and deformations of laser stripes (LaSt) in the two-dimensional (2D) images. Additionally, due to the disparity in viewpoints between the left and right cameras, the same LaSt may exhibit different discontinuity patterns in the left and right images, thereby making it difficult to realize stereo matching of laser points across the two views. Existing LaSt matching methods struggle to yield accurate matching of LaSt between the left and right views, particularly for complex object surfaces or in dynamic scenarios. We aim to tackle the challenge of LaSt matching in a handheld BMLL 3D reconstruction system, and thus improve the accuracy and robustness of the matching process, thereby enhancing the overall reconstruction performance of the handheld BMLL 3D reconstruction system.
A novel LaSt matching method for the handheld BMLL 3D reconstruction system is proposed. Firstly, sensor parameters are obtained via system calibration, including the intrinsic and extrinsic parameters of the cameras, 2D line equations, and 3D laser plane equations. Next, regional consistency (RC) is utilized for coarse matching, which enables the rough localization of the corresponding points of laser centroids from the left image to the right image, thus narrowing down the search range for potential matches. Subsequently, precise LaSt matching is achieved by a combination of reprojection and voting scoring mechanism. The reprojection step calculates the matching point for a single laser point from the left image to the right image, while the voting scoring mechanism enhances matching reliability by maximizing the number of matching points, reducing the influence of a single-point error. Finally, a reverse matching strategy is employed to ensure accurate matching of previously unmatched LaSt in the right image, further improving the completeness of the matching process.
Experimental results demonstrate that the proposed LaSt matching method exhibits superior matching performance across various scenarios involving different test objects and LaSt with varying breakage forms. Comparative experiments reveal that the proposed method outperforms existing techniques in matching continuous, monotonically changing, and non-monotonically changing LaSt, with significant improvements in matching accuracy and reconstruction rates, particularly in non-monotonic scenarios (Figs. 12 and 13). The method achieves an average matching accuracy of 98.746% and an average reconstruction rate of 81.599% across multiple test objects (Table 1). For the reconstruction of a standard 3D sphere, the diameter error is less than 0.107 mm, and the error in sphere center distance is less than 0.143 mm, which further validates the effectiveness of the proposed method (Fig. 15). Additionally, the method demonstrates excellent adaptability across different experimental objects and hardware platforms, confirming its stability and robustness in complex scenarios and diverse hardware conditions (Figs. 16?18). Additionally, the entire system utilizes CUDA acceleration, yielding a processing speed of 17 frame/s.
A novel LaSt stereo matching method based on RC and a voting scoring mechanism is introduced. This method employs system calibration, coarse matching, fine matching, and a reverse matching strategy to tackle the challenges of irregular discontinuities and deformations of LaSt caused by surface modulation and occlusion of the test objects. It significantly improves the LaSt stereo matching performance in the BMLL 3D reconstruction system. 1) Matching accuracy increase. The proposed algorithm mitigates the mismatches in traditional methods, particularly in scenarios with significant deformations. 2) Robustness improvement. By incorporating RC constraints and a voting scoring mechanism, the method suppresses mismatches and enhances the stability and reliability of the algorithm. 3) By leveraging CUDA-based parallel computing, the proposed method achieves a processing speed of 17 frame/s in experiments, while maintaining high matching accuracy and robustness, thereby providing support for real-time 3D reconstruction. The proposed LaSt matching method enhances the overall performance of the BMLL 3D reconstruction system, with significant potential for applications in highly accurate 3D measurements. The method provides technological support for practical applications such as intelligent manufacturing, navigation, localization, and automated repair. Future work will focus on both optimizing the algorithm for wider application scenarios and further improving the extraction of laser center lines.
.- Publication Date: Mar. 21, 2025
- Vol. 45, Issue 5, 0515002 (2025)
We propose a kind of novel cascade optical tweezers for the capture and isolation of particles with high/low refractive indices. The device is made of a tapered fiber-optic probe nested, inserted into capillary microtubules, and achieves the stable capture of particles with different refractive indices by combining optical force and capillary force. Based on finite element simulation, the optical field distribution and particle force are analyzed. Meanwhile, capture and suspension experiments on yeast cells, polystyrene (PS) microspheres, silica particles, and magnetic particles are carried out by adopting a 980 nm wavelength laser. The experimental results show that the cascaded optical tweezers exhibit sound performance in capturing particles with different refractive indices. The proposed cascaded optical tweezers provide a new technological means for both particle capture in the biomedical field and isolation operations in complex environments.
We develop cascaded optical tweezers based on the integration of fiber optic tweezers and capillary microtubules, which can be adopted for the capture of biological cells, non-biological particles, particles with different refractive indices, and non-uniform magnetic particles. Additionally, a light source with a 980 nm wavelength is passed into the tapered fiber optic probe which is nested with a capillary microtubule to form a particle “isolation zone”. At the same time, by employing the capillary phenomenon at the nested insertion and the joint action of optical force, the particles move from the tip of the microcavity optical waveguide to the tip of the tapered optical fiber probe, thus realizing the capture of biological and non-biological particles, and non-uniform magnetic particles. Furthermore, the “isolation zone” formed by the nesting of the microcavity optical waveguide and the tapered fiber probe can effectively isolate and protect the captured particles from the interference of the external environment, thereby enhancing the stability and controllability of the capture process.
Yeast cells, PS particles, silica particles, and magnetic particles are selected for the experiments, as shown in Figs. 6 and 7 respectively. When the yeast cells are in the microcavity optical waveguide port of the cascaded optical tweezers, due to the combined effect of the optical force generated by the fiber optic probe and the capillary force generated by the cascaded optical tweezers, the cells move toward the inside of the microcavity cascaded optical tweezers to the tapered fiber optic tip, which is isolated from the outside particles in solution. The movement process of yeast cells is shown in Fig. 6(a). Due to the different refractive indices of various particles, the optical power of the laser beam is adjusted to 0.54, 1.52, and 0.4 mW for the capture and collection experiments of PS particles, silica particles, and magnetic particles with the size of 5
We propose a novel cascaded optical tweezer system that integrates single-fiber optical tweezers and capillary microtubules to achieve efficient capture and isolation of particles with different refractive indices and non-uniform characteristics in liquid media by introducing a 980 nm wavelength laser beam via a tapered fiber probe. The experimental results show that the cascaded optical tweezers exhibit excellent capture performance in background media with various refractive indices, especially in the capture of particles with different refractive indices, such as yeast cells, PS particles, silica particles, and magnetic particles, demonstrating highly stable manipulation ability. The design of this device not only significantly improves the flexibility of capturing multiple particles, but also broadens the application of optical tweezers in complex environments. Finally, new technical means and theoretical support are provided for fine particle manipulation and efficient capture in biomedical science, materials science, and micro- and nanotechnology in the future.
.- Publication Date: Mar. 21, 2025
- Vol. 45, Issue 5, 0517001 (2025)
As a core component of the opto-mechanical structure in large-scale optoelectronic equipment, the optical workbench directly affects the imaging quality of optical systems. The workbench must possess sufficient structural rigidity and a high lightweight ratio to minimize gravitational deformation, enhance portability, and improve maneuverability. In addition, it must exhibit high dimensional stability and minimal thermal deformation to ensure adaptability in ground environments. Utilizing new structures and materials has significant potential to refine large-size opto-mechanical designs and enhances the performance of ground-based optoelectronic equipment. In this paper, we propose the design of an optical workbench with honeycomb sandwich structure for a 430 mm clear aperture telescope, aiming to improve its lightweight ratio and thermal stability.
An equivalent modeling approach is developed to ensure high simulation accuracy for opto-mechanical components. In this method, carbon fiber reinforced plastic (CFRP) facepanels and aluminum honeycomb cores are modeled as shell elements with in-plane anisotropy and solid elements with orthogonal anisotropy, respectively. Equivalent physical properties of the facepanels are derived from the laminate theory, while those of the honeycomb cores are derived using the cellular geometry and material mechanics principles (Tables 1 and 2). Facepanels, prepared with M40J/cyanate ester prepreg at a thickness of 0.10 mm, feature a quasi-isotropic symmetric layup of [0°/±45°/90°]S to reduce moisture absorption and enhance long-term dimensional stability. Three types of aluminum alloy inserts, heavy-load, edge, and light-load, are designed to meet the various installation interfaces while maintaining the structure’s stiffness and reliability (Fig. 4). Based on simulations, the facepanel thickness is determined to be 1.6 mm and the workbench height to be 40 mm, resulting in a final design weight of 3.03 kg for the 490 mm workbench (Fig. 3). The two parameters, facepanel thickness, and workbench height, together determine the stiffness of the workbench, which in turn affects the static and dynamic characteristics of the telescope (Fig. 5). To manufacture the complex honeycomb sandwich structure reliably, a combined hot bonding and cold bonding process is developed (Fig. 6). The main body is formed using hot bonding under high temperature and high pressure in an autoclave, while the inserts are bonded to the facepanels using an adhesive that cures at room temperature, completing the process.
Simulations show that under horizontal optical axis gravity, the relative displacement and angle between the primary and secondary mirrors are 8.09 μm and 2.21″, respectively, meeting the design requirements (Table 3). The quasi-isotropic CFRP facepanels exhibit low coefficients of thermal expansion, effectively minimizing in-plane thermal deformation. Under a 10 ℃ uniform temperature change, the RMS value of primary mirror surface accuracy deviation is 12.655 nm, well within the design requirements (RMS≤λ/30, λ=632.8 nm). Maximum stresses in the facepanels (8 MPa) and honeycomb core (0.4 MPa) are significantly below material strength limits. A forced displacement of 0.05 mm results in a negligible RMS surface accuracy deviation of 0.745 nm, confirming the workbench’s capacity to uniformly transfer external loads. The proposed workbench with honeycomb sandwich structure exhibits good stiffness, thermal stability, and insensitivity to manufacturing errors and assembly stresses. Dimensional stability is verified through coordinate measuring machine (CMM) measurements of the facepanel inserts over six months, showing stable flatness with fluctuations below 5 μm (ranging from 0.020 mm to 0.035 mm) (Fig. 7). To evaluate the system stability of the telescope, a mechanical prototype is constructed, and a high-precision photoelectric theodolite is used to monitor the relative elevation angles between the reference prisms on each component (Fig. 8). The test spans 1.5 months, during which the relative angles between the prisms remain stable, with a maximum drift of only 2.88″. Following alignment and assembly (Fig. 9), the system wavefront error of the actual telescope at the center field of view is measured to be RMS 36.45 nm at normal temperature (20 ℃), RMS 36.58 nm at relative low temperature (18 ℃), and RMS 36.64 nm at relative high temperature (23 ℃) (Fig. 10). These results demonstrate that the telescope consistently maintains excellent imaging quality within the ambient temperature range of 18?23 ℃.
The monitoring data from the CMM confirms that the developed workbench has excellent long-term dimensional stability in conventional ground environments. The proposed honeycomb sandwich structure design is both feasible and reliable in terms of its preparation processes. Mechanical prototype testing further demonstrate that the optical system of the telescope, with the workbench as its core component, remains in a stable state, with no significant degradation in mechanical performance observed under ground conditions. In addition, the CFRP facepanels prepared with M40J/cyanate ester prepreg exhibit low moisture absorption, contributing to the workbench’s stability. System wavefront error data shows that the telescope equipped with this workbench achieves good thermal stability and maintains accurate relative positioning between the primary and secondary mirrors, even as ambient temperature fluctuates within a certain range. The honeycomb sandwich workbench we proposed demonstrates high specific stiffness and stability, meeting the demands of high-performance opto-mechanical structures. This technical approach can also be applied to enhance the performance of similar equipment operating in conventional ground environments.
.- Publication Date: Mar. 24, 2025
- Vol. 45, Issue 5, 0522001 (2025)
During the assembly and adjustment process of an off-axis three-mirror optical system, a KAN-Transformer-based (Kolmogorov-Arnold network-Transformer-based) misalignment prediction model is developed to address issues such as the mutual coupling of aberrations due to misalignment, low calculation accuracy, and inefficiency in small-scale misalignments. The model uses 1 to 9 fringe Zernike coefficients derived from system wavefront decomposition across multiple fields of view as inputs. It employs the KAN-Transformer model to predict system misalignment values, which are then iteratively adjusted to complete the assembly process. Experimental results from 1000 misalignment calculations demonstrate that the KAN-Transformer model achieves an average error reduction of 0.0095, 0.0065, and 0.0048 mm compared to back-propagation (BP), KAN, and Transformer models, respectively. This improved accuracy allows precise misalignment calculations, avoids local optima, and better captures the nonlinear relationships between mirror misalignments and system wavefront aberrations in complex optical systems. The method described enhances calculation accuracy under small-scale misalignments by approximately 0.00618 mm. Mean square error (MSE) and mean absolute error (MAE) for the KAN-Transformer model are improved by 44.6% and 73.7%, respectively, compared to BP networks, and by 25.3% and 34.6%, respectively, compared to Transformer networks.
The computer-aided assembly technique for large and complex optical systems utilizes simulations to calculate misalignment values for each optical component, guiding actual assembly and improving efficiency. This approach provides a more precise and efficient solution for assembling and debugging optical systems and is widely used in aerospace, military, and photolithography applications. The prediction model utilizes fringe Zernike coefficient data obtained from the wavefront decomposition of the optical system through an interferometer. It calculates the initial system misalignment using a trained prediction network and subsequently adjusts the optical system with precision to meet design specifications. To improve the accuracy of system misalignment predictions, a large dataset of misalignment values corresponding to the first to ninth fringe Zernike coefficients across five fields of view is proposed. The KAN module replaces the linear transformation layer in the Transformer architecture, resulting in the KAN-Transformer model, which facilitates faster and more accurate calculations of the system’s initial misalignment.
Firstly, a KAN-Transformer neural network model is developed (Fig. 4) and jointly debugged using Zemax and Python. An API script is written to generate a dataset, yielding 10000 sets of imbalanced data for training. The network is trained on this dataset and subsequently used to simulate the installation and adjustment of an off-axis three-mirror optical system. The KAN-Transformer neural network achieves an average absolute error of 0.0012 mm in the case of small-scale misalignment (Fig. 9). After incorporating the misalignment values into the off-axis three-mirror model, the wavefront aberrations are found to be 1.129λ, 1.260λ, and 0.975λ (Fig. 11). When these misalignment values are introduced into the neural network solution, the wavefront aberrations improve significantly to 0.066λ, 0.078λ, and 0.035λ (Fig. 12), meeting the system design requirements. Further analysis of 1000 different networks reveals that installation and adjustment prediction errors are significantly larger with the BP neural network, which has an average error of 0.0104 mm. The KAN neural network shows an average error of 0.0057 mm, while the Transformer neural network has an average error of 0.0074 mm. The KAN-Transformer neural network outperforms all others with the smallest average error of 0.0009 mm (Fig. 13). To verify whether the model can effectively guide real-world installation and adjustment, 1000 sets of simulated F(0°, 0°), F(0°, 2°), F(2°, 2°) field-of-view PV error values and RMS error values of the off-axis three-mirror optical system are analyzed. The results indicate that compared to the central field of view, the PV error and RMS errors increase in the F(2°, 2°) and F(0°, 2°) fields of view. As the field-of-view angle increases, changes in the specular reflection direction cause greater deviations in the light propagation path, resulting in the gradual accumulation of wavefront errors and higher error values. However, these errors remain within acceptable limits, demonstrating that the KAN-Transformer misalignment prediction model provides sufficient accuracy to guide the actual installation and adjustment process (Fig. 14).
The traditional sensitivity matrix method establishes the relationship between misalignment and aberration, solving it using mathematical models. In contrast, neural networks train on large datasets to understand the influence of misalignment on image quality, enabling non-analytical misalignment calculations. This approach avoids relying on exact representations of imaging forms and misalignment parameters, making it better suited for the increasingly complex tuning of optical systems. To achieve more accurate misalignment calculations after initial adjustments and reduce the number of iterations required, we propose an optical system misalignment prediction model based on KAN-Transformer. By integrating the KAN structure into the Transformer neural network, the model’s nonlinear representation capability is enhanced, improving accuracy for small-scale misalignment calculations and enabling non-analytical system misalignment determination. The MSE and MAE mean values of the KAN-Transformer model are 41.2% and 62.4% of those for the KAN neural network and 22.2% and 50.7% of those for the BP neural network, respectively, demonstrating superior prediction accuracy and generalization ability. For small-scale misalignments, the KAN-Transformer achieves a calculation accuracy of about 0.0008 mm, outperforming the Transformer model. Simulations and adjustments of off-axis three-mirror optical systems verify that the KAN-Transformer provides significantly higher accuracy, proving its ability to effectively guide actual assembly.
.- Publication Date: Mar. 21, 2025
- Vol. 45, Issue 5, 0522002 (2025)
With the rapid development of micro-nano photonics technology, research on metalenses has mainly focused on light field manipulation, especially in the field of highly integrated imaging systems and optical communications. To address the issue of chromatic aberration caused by the limited working bandwidth of metalenses, as well as the challenges associated with small numerical aperture and large side lobe ratio in achromatic metalenses, we design an achromatic metalens based on the joint control of transmission phase and geometric phase. We also conduct in-depth research on its light field control performance, aiming to apply it in the fields of microscopic imaging, infrared detection, and optical communication.
We scan nanopillars of different sizes at different wavelengths to obtain the corresponding optical responses [Figs. 2(b) and 2(c)]. We find that, with changes in wavelength and nanopillar size, the cell structure can achieve -π?π phase control. Additionally, we observe that the transmittance of the nanopillars remained above 80%, regardless of size changes. We also notice that the light is confined within the nanopillars [Fig. 2(d)]. Therefore, we believe that the nanopillar dielectric unit meets the design requirements for this band. By calculating the ideal phase required for metalens focusing, as shown in Fig. 1(b), and comparing it with the simulated optical response, we notice the closest value, which helped establish the actual required phase response matrix. Using this matrix, the metalens model is created, as shown in Fig. 1(a), and simulated to obtain the light field intensity distribution map and focusing characteristics. To compare with achromatic metalenses, we also design a non-achromatic metalens with an operating wavelength of 1650 nm. We test the performance of the single-wavelength metalens at different wavelengths.
The discrete values of the light waves in the range of 1450?1650 nm are obtained, along with the field intensity distribution of the positive incident left-handed circularly polarized light, as shown in Fig. 3, and the focusing characteristics, as shown in Fig. 4. We calculate that the metalens had an average focal length of 13.89 μm, an average focusing efficiency of 24%, an average polarization conversion efficiency of 45.5%, an average sidelobe ratio of 0.04, and an average full width at half maximum (FWHM) of 1.04 μm at these wavelengths, approximating the diffraction limit. Additionally, we obtain the x-z plane field strength distribution of a single-wavelength metalens (Fig. 5), which operates at a wavelength of 1650 nm, where the focal point of the lens is at 14 μm. However, at other wavelengths, the focal length of the lens is 18.1 μm. The results show that the single-wavelength metalens exhibits significant chromatic aberration, which makes it difficult to achieve achromatism.
Based on the theory of joint control of the transmission phase and Pancharatnam-Berry (PB) phase, we design a metalens operating in the 1450?1650 nm wavelength band, using SiO2 as the substrate and Si as the nanopillar material. Within the working bandwidth, the phase response of the cell structure can vary in the range of -π?π, and the transmittance remains stable above 0.8. The average focal length of the metalens is 13.89 μm, and the numerical aperture can reach 0.8165, which indicates good focusing performance. Through simulations, a wide-band achromatic metalens is designed with a large working bandwidth, high numerical aperture, and low sidelobe ratio, which makes it suitable for applications in infrared detection, optical communication, microscopic imaging, and other fields.
.- Publication Date: Mar. 18, 2025
- Vol. 45, Issue 5, 0522003 (2025)
Holmium ion-doped yttrium aluminum garnet (Ho∶YAG) crystals are widely recognized for their outstanding optoelectronic properties, which makes them highly suitable for mid-infrared lasers. However, a significant challenge in utilizing these crystals is the thermal effects caused by 2 μm lasers. These effects result in poor beam quality, reduced slope efficiency, limited output power, and compromised operational stability, which pose a major limitation in the development and deployment of high-performance lasers. To address these challenges, it is crucial to explore and understand the transient temperature fields in Ho∶YAG crystals with varying structural designs. In particular, comparing non-bonded Ho∶YAG crystals with double-end bonded ones provides valuable insights into thermal management strategies. Our study systematically simulates and analyzes the transient temperature field distributions of these two Ho∶YAG crystal types when operating with a 2 μm laser. The aim is to evaluate the effects of different structural configurations on temperature control and thermal effects, ultimately improving laser output stability and reliability.
We employ numerical simulation methods to establish a transient thermal model for Ho∶YAG crystals, incorporating their physical properties. The simulation focuses on both the optical field distribution and the transient temperature field distribution in non-bonded and double-end bonded Ho∶YAG crystals. Various pump parameters, such as pump power, beam waist radius, and repetition frequency, are systematically varied to assess their impact on the transient temperature field. Key factors such as thermal conductivity, absorption coefficients, boundary conditions, and material properties are carefully considered and optimized to ensure simulation accuracy and reliability. A multi-physics coupling model is applied to simulate the heat generation and dissipation processes within the crystals, which provides a detailed understanding of how different structural designs influence the thermal behavior of Ho∶YAG crystals.
The difference in the behavior of the two structures in controlling thermal effects is investigated through systematic simulations of the transient temperature fields in unbonded and double-end bonded Ho∶YAG crystals. The light field inside the crystal exhibits its highest intensity at the radial center, which rapidly decays along both the axial and radial directions (Fig. 2). The inhomogeneous light field distribution is the primary factor contributing to the formation of temperature gradients. Simulations of the unbonded crystal reveal that the highest temperature occurs in the region of maximum pump light intensity, 8.3 ℃ higher than the lowest temperature at the crystal’s end face [Fig. 3(a)]. In contrast, the double-end bonded structure demonstrates a more uniform temperature distribution due to the efficient thermal conductivity at the bonded ends [Fig. 3(b)]. Although the temperature variation remains concentrated in the pumped region, the steady-state temperature is reduced by 3.2 ℃. The effect of pump power on the temperature field of the double-end bonded Ho∶YAG crystal is simulated and analyzed (Fig. 4). The results indicate that as the pump power increases from 15 W to 25 W, the maximum temperature rises from 24.7 ℃ to 29.2 ℃, accompanied by a significant increase in the temperature gradient. This demonstrates that higher power leads to greater thermal accumulation within the crystal. Compared to unbonded crystals, the double-end bonded crystals exhibit a more gradual temperature change, effectively mitigating the phenomenon of high-temperature concentration. The variation in beam waist radius also influences the temperature field distribution (Fig. 5). With a waist radius of 200 μm, the heat concentration causes the temperature to rise rapidly, reaching a maximum of 25.5 ℃. However, as the waist radius increases to 300 μm, the heat distribution becomes more uniform, reducing the maximum temperature to 23.9 ℃. This suggests that increasing the waist radius effectively alleviates localized thermal effects. Additionally, the impact of repetition frequency on the temperature field is pronounced (Fig. 6). At a frequency of 250 Hz, the crystal’s surface temperature rapidly increases to 28.6 ℃, whereas at 150 Hz, the maximum temperature is only 24.6 ℃. The higher repetition frequency leads to heat accumulation and uneven heat dissipation, which may result in increased thermal stress and a reduction in the thermal stability of the crystal. Compared with the non-bonded structure, the double-end bonded Ho∶YAG crystal offers a significant reduction in temperature gradient and thermal effects, thereby enhancing the crystal’s performance. Key advantages include efficient heat dissipation at the undoped end faces and a uniform heat conduction pathway, which facilitates better heat diffusion and prevents the formation of localized high-temperature regions. This structural design optimizes the crystal’s thermal management capabilities, ensuring stable operation for high-power laser systems.
Our comparative study provides clear evidence that the doubly-terminated bonded structure offers significant advantages in thermal effect management over the non-bonded structure. By effectively reducing internal temperature gradients, the bonded structure enhances the stability of laser output. Non-bonded Ho∶YAG crystals, on the other hand, are more susceptible to thermal accumulation at high power levels, which leads to uneven temperature distribution and a greater likelihood of thermal damage. The double-end bonded design mitigates these risks by improving the uniformity of heat conduction, minimizing the formation of localized high-temperature regions, and increasing the overall durability of the crystals for high-power laser applications. The findings underscore the importance of structural optimization in the design of Ho∶YAG crystals for high-performance laser systems. The bonded structure not only enhances thermal management but also supports stable, high-power, and long-duration laser operation. These insights provide a valuable reference for future advancements in mid-infrared laser technology, offering a pathway to achieving more reliable and efficient laser systems.
.- Publication Date: Mar. 21, 2025
- Vol. 45, Issue 5, 0523001 (2025)
We propose a method for accurately controlling the orientation of ellipsoidal particles in three-dimensional space with arbitrarily polarized vector beams. By conducting theoretical modeling and simulations, we explore the optical force distribution, potential well characteristics, and orientation dynamics of ellipsoidal particles with specifically polarized vector beams. Traditional optical tweezers have limitations when manipulating non-spherical particles like ellipsoids. However, our method overcomes these challenges, providing precise and stable control of ellipsoidal particles. The results not only demonstrate the feasibility of trapping ellipsoidal particles at the focal point but also reveal a direct relationship between the polarization direction of the trapping beam and the spatial orientation of the particles. This manipulation has significant implications, thus providing technical support and a theoretical foundation for advances in micro-nano technology, biomedical research, and nanomaterials. Potential applications include drug delivery, biosensing, and nanofabrication fields, where precise control of particles enables innovations.
In the theoretical model, the optical field in the focal region of a vector beam with arbitrary polarization can be derived by adopting dipole inversion and the Richard-Wolff vector diffraction theory. Theoretical calculations reveal the distribution of optical forces on ellipsoidal particles under different vector beams, including gradient forces, radiation, and spin torque. By applying the Clausius-Mossotti correction theorem, we derive the expression for the electric polarizability of anisotropic ellipsoidal particles in the local coordinate system. Additionally, a rotation matrix transforms the particle’s polarizability from the local to the laboratory coordinate system, thereby ensuring an accurate representation of the interaction between the optical field and the particle. In the simulations, we analyze the optical field distribution, including intensity and polarization, of vector beams with varying polarization and their effects on trapping ellipsoids. The optical force distribution on ellipsoidal particles under different vector beams with varying polarization is examined, with a focus on the magnitude and direction of transverse and longitudinal forces. Meanwhile, the optical potential well depth is calculated to assess the conditions for stable trapping. Additionally, the torque and rotation of the ellipsoidal particles are studied, revealing their three-dimensional orientation and the relation to the polarization direction of the incident light.
We calculate the optical forces, including the gradient and radiation forces, which act on ellipsoidal particles trapped by arbitrarily polarized vector beams. Notably, the gradient force is the primary mechanism for trapping ellipsoidal particles, while the radiation force effect is minor. At the focus, optical forces create a three-dimensional equilibrium, with the transverse force drawing the particle toward the focus and the longitudinal force ensuring symmetry for stable trapping. By calculating the optical potential well depth, we find that optical fields with various polarizations can create deep wells, counteracting Brownian motion and enabling stable trapping. Simulations show that stable trapping of ellipsoidal particles is possible, regardless of the beam’s polarization direction. In analyzing the optical forces acting on ellipsoidal particles, it is essential to examine how the particles are trapped at the minimum of the potential well and to understand how the optical torque affects their orientation in three-dimensional space. The results show that when beams with arbitrary polarization are employed to trap ellipsoidal particles, the optical forces can trap the particles at the focal point, and the spin torque aligns the ellipsoidal particle’s major axis with the polarization direction. By adjusting the polarization of vector beams, including polar and azimuthal angles, precise three-dimensional orientation control of the particles can be achieved. The spin torque aligns the particle’s major axis with the polarization direction, which leads to stable orientation. The results not only deepen our understanding of the particle trapping dynamics at the nanoscale but also provide theoretical support for the development of more efficient optical manipulation techniques.
First, we adopt the dipole back-propagation theory to derive the field distribution of vector beams with arbitrary polarization in the focal region. Then, we calculate the optical forces and potential well distributions that govern the trapping of ellipsoidal particles with specific polarization. The results show that the vector beams in our study can stably trap ellipsoidal particles at the focal point. Furthermore, we investigate how the spatial orientation of ellipsoidal particles’ under stable trapping relates to the polarization direction of the trapped beam. Our results show that under stable trapping, the spatial orientation of ellipsoidal particles aligns completely with the polarization direction of the trapped light. This suggests that by designing the incident light beam, we can achieve precise orientation control of ellipsoidal particles. Therefore, our research has great potential to advance micro-nanotechnology, biomedicine, and nanomaterials, opening up new opportunities for innovation in these rapidly evolving fields.
.- Publication Date: Mar. 10, 2025
- Vol. 45, Issue 5, 0526001 (2025)
In hybrid quantum systems of micro/nano photonics devices and cold atoms, the fictitious magnetic field generated by the constrained light field for atoms has the advantages such as a high gradient, ease of manipulation, and chirality. Therefore, such systems hold significant applications in atomic manipulation, quantum information, quantum simulation, and precision measurement. The calculation and analysis of fictitious magnetic fields are crucial and indispensable. However, for micro/nano photonics devices with irregular structures, it is impossible to obtain the optical field distribution analytically, making it difficult to directly acquire the fictitious magnetic field. In our study, the finite element method is used to numerically simulate the electric field distributions of the nanofiber waveguide and rectangular waveguide, and the fictitious magnetic field distributions are calculated accordingly. We systematically study the fictitious magnetic field intensity as a function of the size of the two micro/nano waveguides. This work provides theoretical guidance for the experimental study of single-atom traps and internal state manipulation using this micro/nano photonics structure.
We numerically simulate a fictitious field of nanofibers and rectangular waveguides. The material of the waveguides is silica, with a refractive index of 1.4537 (Fig. 1). The optical wavelength of 880 nm is used because the scalar optical frequency shift of the ground state is 0, which indicates that the optical field of the 880 nm laser will not affect the atom trap and only produces a fictitious magnetic field (Fig. 2). The power of the laser is set to 1 mW, and the polarization is in the y direction. The field intensity distributions of the nanofibers and rectangular waveguide are numerically simulated via the finite-difference time-domain method (FDTD, Lumerical solutions) (Figs. 3 and 8). After obtaining the electric field intensity distribution, we calculate the fictitious magnetic field intensity distribution using Eqs. (1)?(8) for the optical frequency shift and the matrix operation method (Figs. 4 and 9).
The fictitious magnetic field obtained through finite element numerical simulation is consistent with the analytical results for the nanofibers, which verifies the feasibility of this method (Fig. 6). To obtain the maximum fictitious magnetic field strength, we optimize the fiber diameter. The diameter of the nanofiber is changed from 0.2 to 1.0 μm. The maximum value of the fictitious magnetic field first increases and then decreases as the nanofiber diameter increases, and it can reach 68.3 G when the nanofiber diameter is 0.475 μm (Fig. 7). To obtain the maximum fictitious magnetic field, we optimize the aspect ratio of the rectangular waveguide. The side lengths of the square rectangular waveguide are changed from 0.1 to 1.0 μm. When the side length is 0.475 μm, the maximum value of the fictitious magnetic field reaches 53.61 G [Fig. 11 (a)]. To determine the maximum of the fictitious magnetic field with a changing aspect ratio, the rectangular waveguide length is kept at 0.475 μm, and the width value is changed from 0.1 to 1.0 μm. The maximum value of the fictitious magnetic field of the rectangular waveguide first increases and then decreases as the width increases. When the aspect ratio is 1 (a square waveguide), the maximum value of the fictitious magnetic field reaches 53.61 G [Fig. 11(b)].
We verify the feasibility of finite element numerical simulations of fictitious magnetic fields and provide a method for calculating the fictitious magnetic field of complex micro/nano structures. A numerical simulation of the nanofiber waveguide and rectangular waveguide is implemented, and the distributions of the electric field and fictitious magnetic field are obtained. For the nanofibers, the maximum value of the fictitious magnetic field first increases and then decreases as the nanofiber diameter increases, and it can reach 68.3 G when the nanofiber diameter is 0.475 μm. For the square waveguide, the maximum value of the fictitious magnetic field first increases and then decreases as the side length increases. When the side length is 0.475 μm, the fictitious magnetic field reaches a maximum of 53.61 G. When it is a square waveguide, the maximum value of the fictitious magnetic field reaches 53.61 G. The above simulation results provide a theoretical basis for determining the relative size of the fictitious magnetic field when the rectangular waveguide is used to capture atoms.
.- Publication Date: Mar. 17, 2025
- Vol. 45, Issue 5, 0527001 (2025)
For long-term on-orbit radiation measurements, instruments inevitably face degradation problems, and the measurement data need to be radiometrically corrected. To address the degradation issue, tungsten lamps are commonly used as standard calibration lamps for radiation calibration. However, the commonly used radiation calibration method with tungsten lamps faces the problem of a low signal-to-noise ratio in the ultraviolet wavelength bands. Tungsten lamps cannot be used for radiation calibration below the 400 nm band, which means that in the ultraviolet band, the signal-to-noise ratio of the measurement data is low and is significantly affected by noise, introducing larger errors. Therefore, when using tungsten lamps for calibration alone, the calibration effect in the ultraviolet band is poor, and as a result, the instrument’s measurement data do not correspond to the actual degradation in the band, which makes effective calibration impossible. To improve the accuracy of ultraviolet band calibration, a combined mercury/tungsten lamp on-orbit radiometric calibration method is proposed. This method combines the commonly used on-orbit wavelength calibration lamp and the mercury lamp with the characteristics of the mercury lamp itself, extending the spectral range that can be corrected. By combining the two lamps, the ultraviolet band, which could not be corrected by tungsten lamps alone, can now be calibrated effectively, thus extending the correctable spectral range.
We propose a combined mercury/tungsten lamp radiometric calibration method based on the degradation of tungsten lamp radiometric calibration and the combination of mercury lamps, which are commonly used for wavelength calibration in orbit. This method utilizes the relative proportionality between the spectral radiation values of mercury lamps, with mercury and tungsten lamps used in combination to perform on-orbit radiometric calibration. When performing tungsten lamp radiation calibration, the tungsten lamp shows high repeatability and good stability. After calibration, the influence of its degradation is removed, and the change in its radiation value represents the degradation of the instrument. However, the measurement values in the ultraviolet band cannot reflect the instrument’s degradation due to the low signal-to-noise ratio. To address this, a mercury lamp is added to the system. Although the mercury lamp’s radiation value is unstable, there is a relative proportionality between the spectral radiation values of both the mercury and tungsten lamps. This relationship allows the mercury lamp to help correct the radiation in the ultraviolet band. The mercury lamp enables relative calibration of the ultraviolet band, but it cannot be used for absolute calibration. The tungsten lamp, on the other hand, allows for absolute calibration. By using the overlapping spectral range of both lamps, the spectral lines from the tungsten lamp can be used in conjunction with the irradiance of the mercury lamp for further absolute calibration. In summary, the addition of the mercury lamp before the overlap extends the relative calibration spectral range, while the overlap extends the absolute calibration spectral range of the tungsten lamp. The resulting change in irradiance over time of spectra corrected by the combined mercury/tungsten lamp radiometrically represents the instrument’s degradation, which can then be further corrected for instrumental degradation.
We incorporate the mercury lamp into the degradation calibration process, and propose a joint mercury lamp/tungsten lamp degradation calibration method. The flowchart of this calibration method is shown in Fig. 4, which solves the problem of the traditional tungsten lamp alone being unable to cover the entire measurement spectrum. This approach expands the spectral range of degradation calibration and optimizes the calibration effect. It broadens the radiance-correctable spectral range from 400?700 nm to 250?700 nm, reduces measurement uncertainty from up to 25% (when degradation is uncorrectable) to 2.7% (after degradation calibration), and successfully corrects degradation in the previously uncorrectable 250?400 nm waveband by up to 22.3% over a two-and-a-half-year period.
In the radiative calibration of the degradation of on-orbit radiometric instruments, the commonly used tungsten lamp radiative calibration method faces the problem of low signal-to-noise ratio in the ultraviolet band. To improve calibration accuracy in this range, we propose a combined mercury/tungsten lamp on-orbit radiative calibration method. This method utilizes the relative proportionality between the spectral radiation values of mercury lamps and combines them with the tungsten lamp for on-orbit radiation calibration. By extending the radiatively correctable spectral range from 400 down to 250 nm, the instrument’s degradation in the 250?400 nm band, which cannot be corrected previously, is successfully corrected by up to 22.3% over a two-and-a-half-year period. The method effectively reduces measurement uncertainty from 25% to 2.7%. Further analyses demonstrate both the effectiveness and limitations of the method.
.- Publication Date: Mar. 10, 2025
- Vol. 45, Issue 5, 0528001 (2025)
As remote sensing technology continues to develop and high-resolution images are widely used, the application of remote sensing change detection is increasing in environmental monitoring, urban planning, and disaster assessment. Especially when applying high-resolution remote sensing images, accurate detection of surface changes is crucial for revealing environmental change trends and supporting decision-making. Timely and accurate identification of surface changes not only helps improve post-disaster reconstruction, ecological restoration, and resource management but also provides essential supporting information for governments and related departments. However, existing change detection methods still face challenges, such as insufficient local feature extraction, difficulty in modeling global dependencies, and excessive computational complexity when handling large-scale, high-resolution images. Additionally, they are easily affected by light and seasonal variations, which leads to pseudo-changes, false detections, or omissions. To overcome these challenges, we propose a remote sensing image change detection network based on change guidance and bidirectional Mamba (CGBMamba). By combining the long-range dependency modeling capability of the bidirectional Mamba module with the a priori knowledge of deep change-guided features, CGBMamba effectively fuses local details with global features to improve change detection accuracy. Additionally, we design a time domain fusion module to further enhance the model's ability to capture temporal changes by fusing bi-phasic features through a cross-temporal gating mechanism. CGBMamba reduces the effect of noise or detail errors on change detection by introducing smoothed residuals, which boosts the model’s robustness in complex scenes. This method addresses the limitations of existing change detection techniques in local information extraction and global dependency modeling for high-resolution remote sensing images. It also strengthens the model's resistance to external factors such as illumination and seasonal disturbances.
The CGBMamba network utilizes a two-channel encoder-decoder architecture, consisting of two main components: the time domain fusion module (TAM) and the bidirectional Mamba module, as illustrated in Fig. 2. Initially, a two-branch shared-weight encoder processes dual time-phase images, with each branch employing ResNet18 for feature extraction. Next, the time domain fusion module merges features from different time phases and scales to capture the change information. This module leverages the complementary information from the dual-time-phase images to generate a fused feature map that is rich in change-related features. Simultaneously, the deepest features from the fused map are passed to the classifier for prediction. The resulting deep change feature map is then sent to the bidirectional Mamba module, along with the fused feature map. As a core module, the bidirectional Mamba module refines the time domain information and integrates local features with global dependencies to improve change detection accuracy. It strengthens the interrelationships between time domains through bidirectional transfer and extracts deep change features through multilevel information fusion.
To validate the effectiveness of our method, we conduct experiments on three remote sensing change detection datasets: 1) LEVIR-CD dataset. Captured by the Gaofen-2 satellite, this dataset contains change samples from several urban areas with a resolution of 0.5 m. Our method achieves an F1 score of 90.42% and an intersection over union (IOU) of 82.51%, significantly outperforming other comparative methods, particularly when handling small and detailed targets. The visualization results demonstrate that our method can effectively identify complex changing regions, especially in the presence of shadows and color variations, exhibiting greater robustness. 2) CLCD dataset. This dataset includes building change samples under varying environmental conditions, with a resolution of 0.8 m. Our method achieves an F1 score of 75.15% and an IOU of 60.20%, providing higher accuracy and robustness than other methods, particularly in the presence of small targets and complex backgrounds. The visualization results further highlight our method's superior ability to accurately identify changing targets in color-similar regions. 3) SYSU-CD dataset. This dataset features irregularly shaped and complexly distributed changing targets, with a resolution of 1 m. Our method achieves an F1 score of 81.34% and an IOU of 67.35%, demonstrating strong performance in detecting irregularly shaped targets and recognizing edges. Compared to other methods, our model effectively addresses data imbalance and maintains efficient detection performance across a wide range of targets with varying shapes and sizes. The visualization results from the three datasets indicate that the introduction of TAM at the encoder stage significantly improves the model's ability to recognize changing regions by enhancing the fusion of features across different time stages. This is especially beneficial in cases involving small changing regions or complex backgrounds, which can enable the model to capture more detailed change information. In the decoder stage, BMamba helps the model recognize change targets of different scales and shapes in complex scenes by processing both long- and short-range dependencies, thereby strengthening the feature correlations. Our method outperforms the selected comparison methods when benchmarked against eight classical change detection methods. Additionally, ablation studies across the three datasets further validate the effectiveness of each module in boosting overall performance.
We propose a change detection method for remote sensing images based on CGBMamba, which improves the detection of complex change targets by combining deep change guidance features with bidirectional Mamba modules. The change guidance leverages a priori information to guide the fusion of multi-scale features, ensuring that critical change information is preserved. Meanwhile, the bidirectional Mamba module optimizes the fusion of local details and global features by capturing long-range dependencies, thus improving the accuracy and efficiency of change detection on large-scale, high-resolution remote sensing images. Additionally, the time domain fusion module further boosts the performance of CGBMamba in handling dual-time-phase changes by accurately capturing subtle change features through cross-time and cross-scale mechanisms, while minimizing the impact of noise and detail errors on detection results.
.- Publication Date: Mar. 10, 2025
- Vol. 45, Issue 5, 0528002 (2025)
Synthetic aperture radar (SAR) technology is crucial for ship detection in both military and civilian applications, which offers imaging capabilities in all weather conditions, day or night. However, SAR images present unique challenges due to the multi-scale characteristics of ships, varying vessel sizes, complex backgrounds, and speckle noise. These factors often lead to significant loss of semantic information, especially for small targets, which hinder the performance of conventional ship detectors. The limited computing resources on remote sensing platforms further exacerbate this issue. As a result, there is a strong need for algorithms that are both accurate and computationally efficient. Therefore, we aim to address the limitations of current ship detection algorithms by designing a novel, lightweight, and robust architecture that emphasizes the accurate detection of small targets in complex SAR imagery. We introduce an advanced approach that strikes an optimal balance between precision and computational efficiency, specifically for better detection of multi-scale objects, while maintaining low model complexity and ensuring feasibility for deployment on resource-constrained platforms.
To tackle these complexities, we propose the multi-scale spatial pyramid pooling fast (MSPPF) module. This module is specifically designed to address the loss of multi-scale semantic information caused by successive pooling operations. MSPPF simultaneously performs pooling operations at multiple scales on input feature maps, enabling the network to preserve fine-grained spatial information while capturing contextual information across various scales. To further enhance feature extraction, we incorporate the efficient multi-scale attention (EMA) mechanism, which captures channel-specific semantic information across scales and uses it for adaptive feature aggregation. By reweighting features and using local contextual awareness, EMA improves the robustness of feature extraction for ships at different scales, including small vessels that are often difficult to identify with high precision in SAR images. We also propose a lightweight shared convolution head (LSCH) to reduce parameters and computational overhead. By extensively sharing convolutional operations in LSCH, we can enhance detection performance via group normalization to optimize location and classification, while using far fewer parameters and simpler computations. This results in a significantly lighter, faster, and more resource-efficient architecture. Finally, a key component of our approach is the improved bounding box loss function, which combines ShapeIoU and Focaler-IoU. ShapeIoU focuses on the shape and overlap of the boxes, while Focaler-IoU targets underestimating bounding boxes and hard examples, particularly smaller objects that have higher prediction errors. This new loss function focuses on object size and aspect ratio differences in predictions with a high level of accuracy while further emphasizing improvements to smaller targets. By addressing both the geometric accuracy of the bounding boxes and the challenging examples, this combination significantly enhances our model's performance, especially for small targets that are typically difficult to predict.
We thoroughly validate our proposed method using the HRSID and SSDD datasets, which are widely recognized benchmarks for SAR-based ship detection. The experimental results demonstrate that our algorithm significantly outperforms the baseline YOLOv8 model, showing improved performance on key metrics while requiring substantially fewer computational resources. Specifically, on the HRSID dataset, our algorithm achieves a 1.8% improvement in average precision (AP) at the 0.5∶0.95 intersection over union (IoU) threshold, alongside a 23.3% reduction in parameters and a 23.2% decrease in computational costs (Table 1). On the SSDD dataset, the results are similarly impressive, with a 3.1% AP improvement at the same threshold, and again, a 23.3% reduction in parameters and a 23.2% reduction in computational costs. This improved detection, especially for small vessels with unusual aspect ratios, is primarily due to our innovative approaches for small target detection in remote sensing, particularly through the Focaler-ShapeIoU loss. These results are attributed to the synergy between MSPPF and EMA, which facilitate better capture of multiscale information and more effective handling of challenging examples (Fig. 5). The LSCH design ensures an optimal balance between detection quality and model complexity. The experimental results clearly show how much we have improved in detecting small and difficult targets, while also reducing parameters and computations, without sacrificing accuracy for multi-scaled vessels (Table 2). The novel bounding box loss function, combining ShapeIoU and Focaler-IoU, enables the accurate prediction of small objects with high aspect ratios. This highlights its effectiveness in improving small object detection, which is more critical than improving general object detection, thus better addressing real-world needs in SAR-based ship detection scenarios. Furthermore, generalization experiments are conducted with YOLOv8n and the algorithm presented in this paper across various datasets. The results show that our algorithm outperforms traditional methods across different datasets and resolutions, thereby validating its generalizability (Table 4).
We introduce a novel, lightweight, multi-scale SAR ship detection algorithm that addresses the challenges of multi-scale ship variations, complex backgrounds, and limited computing resources in remote sensing. By integrating the MSPPF with EMA for effective multi-scale feature extraction, utilizing the lightweight LSCH design to minimize computational cost, and incorporating a custom-designed bounding box loss function that improves small target predictions, our model strikes an optimal balance between high detection accuracy and significantly reduced model complexity. Our proposed technique can be effectively applied to diverse ship scales, achieving an optimal balance between model parameters, performance, and computational demands, as evidenced by improved overall accuracy and enhanced detection of small targets. We provide a new paradigm in SAR ship detection by offering increased precision in detection while simultaneously reducing parameters, computational complexity, and resource requirements. This is particularly evident in the improved detection of smaller, more difficult-to-identify targets through the combination of our new modules and bounding box loss functions. This innovative methodology provides a resource-efficient solution, enabling more widespread deployment and contributing to practical applications for SAR-based ship detection. It allows for faster and more accurate analysis with limited computational capabilities and serves as a key stepping stone toward further deployment on remote platforms.
.- Publication Date: Mar. 17, 2025
- Vol. 45, Issue 5, 0528003 (2025)
Semiconductor manufacturing is driven by the relentless demand for smaller, faster, and more efficient electronic devices, placing immense pressure on innovation and refinement. Optical proximity correction (OPC) stands as a cornerstone of computational lithography, addressing distortions and variations inherent in the photolithographic process. As technology nodes shrink, OPC’s role becomes increasingly critical in maintaining pattern fidelity, enhancing yield, and minimizing manufacturing defects. By correcting optical distortions that arise when printing fine features on semiconductor wafers, OPC ensures the accuracy and reliability of integrated circuit (IC) patterns. In this paper, we highlight the indispensable role of OPC in advancing semiconductor technology, emphasizing its contribution to the performance and scalability of next-generation electronic devices.
OPC has evolved from rule-based methods to sophisticated model-based approaches, leveraging advanced lithography simulations to optimize mask designs. These models accurately represent physical phenomena such as source shape, mask configuration, photoresist exposure, and development processes. Through iterative optimization, experimental data is used to calibrate these models, ensuring consistency between simulation and real-world results. This iterative process improves mask correction accuracy and adaptability, enabling the creation of high-resolution patterns. Researchers have meticulously optimized every aspect of the OPC process, from pattern selection to algorithm development, employing machine learning to accelerate and refine optimization strategies (Fig. 5). A pivotal area of advancement is the management and mitigation of line edge roughness (LER). LER, characterized by random fluctuations along the edges of lithographic patterns, becomes increasingly challenging as feature sizes shrink. Quantitative measurement techniques such as critical dimension scanning electron microscopy (CD-SEM) and atomic force microscopy (AFM), coupled with offline roughness evaluation tools, enable precise LER analysis. Power spectral density (PSD) analysis provides frequency-domain insights into parameters such as correlation length and roughness index, while stochastic modeling techniques, including Monte Carlo simulations and Gaussian models, enable the prediction of LER behavior under diverse process conditions. Transfer functions are critical for quantifying how LER propagates during the etching process, enabling predictions of final pattern characteristics based on initial measurements. Machine learning methods, such as neural networks and support vector machines (SVMs), analyze extensive datasets to optimize process parameters and predict LER effects. Probability prediction models play a vital role in estimating the likelihood of defects caused by LER. By leveraging statistical properties, these models calculate failure probabilities and inform the development of targeted mitigation strategies, thus enhancing yield and device reliability. These innovations enable effective LER management, directly enhancing semiconductor device performance. Design-technology co-optimization (DTCO) has advanced significantly, aligning design rules with the capabilities and constraints of cutting-edge lithography. By addressing manufacturing limitations during the design phase, DTCO improves both manufacturability and device performance. Recent developments in DTCO have proved highly effective in optimizing design rules and process conditions for advanced nodes, including 14 nm and 7 nm technologies. Techniques such as Monte Carlo simulations have been instrumental in analyzing the effects of various design parameters, resulting in improved design rules and reduced process variability. Model simulations play a critical role in DTCO by uncovering complex interactions between design rules and patterning technologies. This enables iterative refinements, enhanced patterning accuracy, and the application of customized optical proximity correction (OPC) and resolution enhancement techniques (RETs). Studies consistently highlight DTCO's ability to align design optimization with manufacturing capabilities, ensuring high manufacturability and yield. These developments collectively enhance the precision, reliability, and efficiency of lithographic processes, driving the ongoing trend toward device miniaturization and the creation of high-performance semiconductor devices.
OPC advancements have profoundly improved the precision and efficiency of photolithography, ensuring continued progress in semiconductor scaling. The integration of machine learning techniques, such as neural network-based OPC and graph convolutional network-based OPC, has revolutionized the field, delivering enhanced computational efficiency and prediction accuracy. In addition, understanding LER transfer functions and leveraging DTCO methodologies have strengthened pattern fidelity and expanded process windows. Looking ahead, OPC research will focus on refining optimization techniques and extending their applicability to even smaller technology nodes. As lithographic processes grow increasingly complex, more precise and robust OPC methods will be required. The integration of artificial intelligence and machine learning in OPC holds immense potential to automate and enhance the optimization process, paving the way for faster, more reliable solutions.
.- Publication Date: Mar. 05, 2025
- Vol. 45, Issue 5, 0500001 (2025)
Three-dimensional (3D) fluorescence spectroscopy is a widely used method for collecting fluorescence signals from phytoplankton and is extensively applied in ecological monitoring and environmental research. However, traditional 3D fluorescence spectroscopy faces challenges in efficiency and real-time performance for on-site rapid detection. In this paper, we propose a parallel acquisition method for quasi-3D fluorescence spectra using software lock-in amplification technique to address these issues. By employing heterodyne modulation of discrete multi-wavelength excitation sources and integrating high-resolution, broad-spectrum signal acquisition with software lock-in amplification, the method enables the simultaneous detection and separation of multi-wavelength-induced fluorescence signals under complex ambient light interference. This significantly improves detection efficiency, data accuracy, and environmental adaptability for in situ quasi-3D fluorescence spectroscopy. Experimental validation demonstrates the ability of the method to rapidly and accurately acquire high-resolution fluorescence spectra at different distances, significantly enhancing the signal-to-noise ratio (SNR). Compared to traditional hardware lock-in techniques, the software-based approach offers greater flexibility and scalability in high-throughput, multi-parameter weak signal detection, with broad potential applications in phytoplankton research and harmful algal bloom monitoring.
Our method utilizes a custom Simulink program to implement software lock-in amplification, enhancing fluorescence signals collected by the spectrometer while effectively mitigating environmental light interference, such as sunlight. The process begins with heterodyne modulation, where multi-wavelength excitation spectra are synchronized with reference signals using sine or cosine waves of different frequencies, mapping the spectral signals to corresponding frequency components. The lock-in amplification module compares the phase of each signal with the reference, amplifying target signals while suppressing background noise and high-frequency components. A low-pass filter is applied to remove residual high-frequency noise and elastic light signals from other modulation frequencies, further improving signal accuracy. Experimental tests validate the method’s effectiveness in eliminating environmental light interference, demonstrating its ability to extract weak fluorescence signals under complex ambient conditions. Tests conducted at distances of 10 m and 5 m reveal significant signal enhancement, with real-time parameter adjustments available to optimize lock-in amplification settings based on experimental conditions. Simulink’s graphical interface facilitates on-site adjustments, ensuring stable, high-precision fluorescence signal detection across diverse environments. This method not only enhances signal accuracy and stability but also provides robust resistance to interference, showcasing broad application potential.
Experimental results confirm the effectiveness of the software lock-in amplification method in improving SNR and eliminating environmental light interference. Initial tests under sunlight conditions reveal that fluorescence signals are heavily obscured, resulting in low SNR and limited extractable information (Fig. 6). After applying the software lock-in amplification technique, fluorescence signals are extracted (Figs. 7 and 8). At a distance of 10 m, the SNR improves from -9.7 to 15.56 dB, while at 5 m, the SNR increases to 25.38 dB. These results highlight the significant improvements in detection accuracy and stability of fluorescence signals by the software lock-in amplification method, even under complex ambient light conditions. In addition, the normalized fluorescence spectra of four distinct phytoplankton are illustrated (Fig. 9). By extracting and analyzing fluorescence signals from various algal samples, this method facilitates the efficient classification of phytoplankton and extraction of relevant biological information. The experimental findings demonstrate the method’s strong adaptability for phytoplankton detection, enabling precise and efficient fluorescence spectrum measurements across diverse experimental conditions.
In this paper, we propose an innovative parallel acquisition method for quasi-3D fluorescence spectra using software lock-in amplification. By employing heterodyne modulation and combining multi-wavelength excitation sources with lock-in amplification technique, this method significantly improves the SNR in complex environments and successfully isolates characteristic fluorescence signals, such as chlorophyll a. Through frequency division multiplexing and algorithm optimization, the approach enhances both the speed and stability of data collection. Compared to traditional hardware-based methods, the software solution offers notable advantages in flexibility, scalability, and cost-effectiveness, particularly for high-throughput spectral data processing. Experimental results demonstrate the effectiveness of the proposed method in suppressing background noise and accurately differentiating fluorescence features of various algae species, providing a reliable foundation for algae classification and ecological monitoring. Further work will explore the integration of advanced classification algorithms and hardware optimization to further enhance practical applications and accuracy across diverse fields.
.- Publication Date: Mar. 21, 2025
- Vol. 45, Issue 5, 0530001 (2025)
Terahertz spectroscopy technology has widespread applications in public safety, precision instruments, biomedicine, etc. However, due to the mismatch between the terahertz wavelength and the absorption cross-section of trace analytes, the interaction between them is very weak, making it difficult to directly detect the terahertz absorption spectrum of trace analytes. Therefore, researchers use waveguides, graphene, and metasurfaces to generate local electromagnetic fields to enhance the interaction between trace analytes and electromagnetic waves. To solve the problem of detecting the broadband terahertz absorption spectrum of trace analytes, researchers propose using the angle-multiplexing or geometric-multiplexing method of metasurface to obtain multiple resonance modes, thereby enhancing the broadband terahertz absorption spectrum. However, there are various shortcomings in the angle-multiplexing and geometric-multiplexing of metasurfaces. One-dimensional photonic crystal defect modes, as one of the important means of electromagnetic field localization, have the advantages of simple structure and good enhancement effect. To further improve the terahertz absorption spectrum enhancement effect based on the photonic crystal defect-mode structure, we design a one-dimensional photonic crystal defect-mode enhancement structure for the terahertz absorption spectrum based on a metal-dielectric periodic structure. By changing the width of the defect cavity, we obtain a series of resonance peaks, thus achieving the broadband terahertz absorption spectrum of trace analytes in the 0.46?0.6 THz wide frequency range. For the 0.2 μm α-lactose thin film, an absorption enhancement factor of about 101.2 can be obtained, while the all-dielectric one-dimensional photonic crystal defect-mode structure with the same geometric parameters can only gain an absorption enhancement factor of 76.2. The enhancement effect is significantly improved. This structure provides a new research direction for improving the terahertz absorption spectrum of trace analytes.
We design a one-dimensional photonic crystal defective-mode-enhanced terahertz absorption spectroscopy structure based on a metal-dielectric periodic structure with a high-density polyethylene (HDPE) dielectric material, a polytetrafluoroethylene (teflon) substrate for the thin-film lactose to be measured, and an Au metal material. The refractive indices of an HDPE plastic layer, teflon, and air are 1.525, 1.43, and 1, respectively. We assume them to be lossless in the simulation as the loss of the materials is very low. We simulate the electromagnetic response of the structure using the finite-element method with transmission and reflection ports in the x-direction and Floquet periodic boundary conditions in the y-direction. The resonant frequency of the defect mode will vary with the number of layers N, the thickness of the dielectric material, the thickness of the air, and the width of the defect cavity. The defect cavity width df, the thickness of the alternating HDPE-metal layer dt, and the thickness of the air layer da can be optimized for different analytical materials to match the characteristic absorption of the corresponding object to be measured. Next, we investigate the specific properties of one-dimensional photonic crystal defect-mode-enhanced terahertz absorption spectral structures based on metal-dielectric periodic structures and the influences of varying each parameter on the enhancement effect.
Firstly, we investigate the transmission spectrum of the structure when the teflon substrate is loaded with or without α-lactose film under the condition of the number of layers N=6, the dielectric model of α-lactose, and the absorption spectrum at this time (Fig.2). We find that the enhancement factor of the designed structure for 1.0 μm α-lactose is 41.5. After that, to show that the enhanced terahertz absorption spectra of the designed one-dimensional photonic crystal defective cavity composed of dielectric-metal are better than those of the one-dimensional photonic crystal defective cavity with pure dielectric, the enhancement effects of the two structures for 1.0 μm-thick α-lactose are investigated for different numbers of layers N (Fig. 3). We observe that the enhancement abilities of the metal-dielectric periodic structure are more than 25.4%, 19.9%, and 7.2%, respectively. To further discuss the enhancement mechanisms, we give the electric field distributions of these two structures at N=6 and df=260 μm (Fig. 4) and the electric field (Ex) distributions of the structure in the x-y plane when the df value is varied from 240 μm to 280 μm in steps of 10 μm for a blank and loaded 1.0 μm α-lactose film (Fig.5). We find that without the metal structure, the maximum intensity of the localized electromagnetic field is relatively weaker than that with the metal structure by 4.1%. Also, the intensity of the electric field with lactose decreases by 28.1%, 40.2%, 44.0%, 35.4%, and 25.0% compared to that of the sample without lactose, respectively. Next, the effects of the number of photonic crystal layers N (Fig. 6), α-lactose thickness t (Fig. 7), and height h (Fig. 8) on the enhanced absorption spectra are investigated at a metal structure thickness of 1.0 μm, respectively. Finally, we investigate the effect of the metal thickness w on the enhanced absorption spectrum in the metal-dielectric periodic structure for N=6 and t=1.0 μm (Fig. 9). We note that saturation occurs if the local electromagnetic field exceeds the upper absorption limit of the object to be measured, which should be avoided in practical design. Table 1 lists the performance comparison among some dielectric hypersurface enhancement structures, existing dielectric one-dimensional photonic crystal defect-mode enhancement structures, and the designed structures.
We propose a one-dimensional photonic crystal defect-mode enhanced terahertz absorption spectrum structure based on a metal-dielectric periodic structure. By introducing a metal periodic structure into the all-dielectric one-dimensional photonic crystal defect-mode structure, the electric field intensity of the Q resonance structure can be effectively enhanced. Then, by adjusting the width of the defect cavity, the terahertz absorption spectrum of the thin-film sample can be enhanced within a wide band. When applied to a 0.2 μm α-lactose thin-film sample, the enhancement factor of this structure is approximately 101.2, while the enhancement factor of the all-dielectric one-dimensional photonic crystal defect-mode structure with the same geometric parameters is only 76.2. The improvement effect is obvious, and the defect cavity structure is convenient for detecting thin-film samples. Currently, the designed structure needs the precise adjustment of the defect cavity width using a precision translation stage to cover a certain frequency range. This brings certain measurement difficulties, but it does achieve wide-band coverage, which is worthwhile for the specific non-labeled detection of the broadband absorption spectrum of the sample. In the future, we can achieve parallel measurements of multiple different resonant cavity structures to simplify the measurement process and increase the measurement speed. Of course, this structure will increase the difficulty of processing and manufacturing, but for better absorption enhancement effects, the manufacturing cost is worth it. In summary, this structure will contribute to the further development of high-sensitivity terahertz detection technology for trace samples.
.- Publication Date: Mar. 18, 2025
- Vol. 45, Issue 5, 0530002 (2025)
Infrared spectroscopy is a technique that utilizes the interaction between matter and infrared light for material analysis, which plays a crucial role in fields such as material analysis, mass spectrometry identification, biomedicine, and military security. As information technology and related disciplines advance, the miniaturization of infrared spectrometers has emerged as a prominent research trend for both current and future applications. However, existing portable infrared spectrometers generally have narrow spectral ranges and low resolution due to the need to balance device miniaturization. Metasurfaces, as artificial two-dimensional materials, possess advantages such as small size and ease of integration. By designing the shape, size, and arrangement of metasurface atoms, researchers can create structures with special modulation effects on the phase, amplitude, and polarization of light, achieving remarkable results in fields such as achromaticity, quantum light sources, color routing, and holographic imaging. In spectral imaging, the use of metasurfaces is expected to overcome the limitations of traditional spectrometers, enabling the realization of high-precision, wide-spectrum, miniature portable spectrometers for infrared applications.
We present a miniature infrared wide-spectrum spectrometer based on the principle of spectral encoding utilizing a metasurface. The morphology of the metasurface consists of a periodic arrangement of 2×2 structural units, each of which provides a distinct modulation effect on the wide-spectrum light. When a beam of wide-spectrum infrared light carrying spectral information is incident on the metasurface, the metasurface encodes the spectral information of the incident light, ultimately yielding a light intensity value. This intensity value can be decoded at the backend using deep learning algorithms to retrieve the spectral information of the incident light. We employ a C4-symmetric metal-dielectric-metal structure, which is insensitive to polarization. When infrared light is incident on the metasurface composed of this structure, a unique electromagnetic field is generated at the interfaces between the upper and lower metal layers and the dielectric. This interaction excites surface plasmons, which represent collective oscillation modes of electromagnetic waves and free electrons at the metal surface. The coupling of the two electromagnetic fields results in band hybridization, leading to resonance at specific frequencies. By varying the materials, heights, and geometries of the metasurface atoms, additional resonance modes can be introduced, allowing for diverse modulation effects on the incident light. To enhance the degrees of freedom of the metasurface atoms and achieve infrared wide-spectrum imaging, we pixelate the unit structure to improve encoding performance. Considering the requirements for high transmittance and ease of fabrication, ZnSe is selected as the substrate material. Simulations are conducted using the finite-difference time-domain (FDTD) method, with periodic boundary conditions applied along the x- and y-axes, and perfectly matched layer (PML) boundary conditions applied along the z-axis.
The unit structure consists of four equally spaced cylinders. By fixing one parameter, either the radius of the cylinders or the distance between them, and varying the other, we obtain different transmission spectra (Fig. 2). This indicates that both the size and arrangement of the metasurface atoms influence transmission rates. To enhance the degrees of freedom of the metasurface atoms, we pixelate the unit structure and randomly place cylinders within the defined regions, resulting in a variety of spectral transmission rates. According to the principles of spectral encoding and compressed sensing, a sparser spectral transmission matrix for each structure of the metasurface is advantageous for computational reconstruction. Therefore, we adopt the correlation coefficient as a criterion for assessing the sparsity of the spectral transmission rates, selecting structures with an average transmission rate greater than 50% as our filtering condition. This process yields four distinct structures (Fig. 3), with the correlation coefficients between the corresponding spectral transmission curves ranging from a maximum of 0.19 to a minimum of -0.16. Utilizing deep learning methods, we simulate the spectral detection process to further investigate the feasibility of our design scheme. The results indicate that for broadband spectra, the accuracy of spectral reconstruction exceeds 90% (Fig. 4). Additionally, to explore the diversity of spectral detection, we also reconstruct spectral curves with narrower unimodal characteristics (Fig. 5). The reconstruction results demonstrate that even at a signal-to-noise ratio of 27 dB, it is possible to achieve a reconstructed spectrum that closely resembles the original spectrum.
Based on the principle of spectral encoding in metasurfaces, a micro-spectral imaging system for 1?10 μm spectral band is designed in this paper. The metasurface is composed of polarization-insensitive, pixelated metal?insulator?metal (MIM) structures, which not only maintain an average transmission rate exceeding 50% across three spectral bands but also exhibit sufficiently low correlation in spectral transmission rates. This design facilitates convenient integration with commercial cameras via a patching approach. Additionally, we utilize deep learning techniques to investigate the spectral reconstruction capabilities of the system. The results indicate that for relatively smooth spectral curves, the reconstruction performance is satisfactory. Moreover, our design method demonstrates a certain degree of reconstruction ability for spectral curves characterized by narrow unimodal features. In summary, we have developed an infrared wide-spectrum miniaturized spectrometer based on metasurfaces, which possesses rapid and non-destructive analytical capabilities. This technology holds significant implications in various fields, including environmental monitoring, medical diagnostics, and national security. Although the current number of spectral reconstruction channels is somewhat limited, advancements and optimizations in reconstruction algorithms are anticipated to enable the realization of a miniaturized spectrometer that maintains high spatial resolution while achieving high spectral resolution in the future.
.- Publication Date: Mar. 26, 2025
- Vol. 45, Issue 5, 0530003 (2025)

