 AI Video Guide
  AI Picture Guide
 AI One Sentence

Yuxuan Xiong, Ting Jiang, Hao Wu, Zheng Gao, Shaojun Zhou, Zhao Ge, Siqi Yan, Ming Tang, "Multimode fiber speckle Stokes polarimeter," Adv. Photon. Nexus 3, 046010 (2024)
- Advanced Photonics Nexus
- Vol. 3, Issue 4, 046010 (2024)
Note: This section is automatically generated by AI . The website and platform operators shall not be liable for any commercial or legal consequences arising from your use of AI generated content on this website. Please be aware of this.
Abstract
1 Introduction
The estimation of the state of polarization (SOP) is critical in various fields, such as optical communications,1 radar imaging,2 and solar astronomy.3 Polarimeters, instruments designed to measure the SOP of light, have received significant attention. Formerly, the focus was primarily on the linearly polarized light and was concentrated on measuring the initial three components of the Stokes vector.4,5 During this period, information about the circularly polarized state, associated with the fourth component, was not obtainable.6,7 Subsequently, comprehensive polarimeters capable of measuring the full Stokes vector were investigated. However, conventional SOP measuring methods, such as the rotating quarter-wave plate technique, necessitate the employment of optical elements like polarizers. The inclusion of diverse optical components increases the complexity of the system, and the measurement results are sensitive to environmental noise. Therefore, it is necessary to explore a simple and effective SOP measurement. Apart from traditional methods, metasurfaces, engineered with designed micronanostructures, have been utilized to conduct SOP measurements with enhanced system compactness.8
Considering easy implementation and cost reduction, the multimode fiber (MMF) emerges as an economically practical and lightweight alternative.13 The large core diameter of the MMF enables the excitation of multiple modes with different phase velocities, and these applications are based on the principle of mode coupling. The coupling of the different modes leads to speckle patterns with light and dark features at the output. The speckle patterns contain both amplitude distribution and phase information for all modes.14
In this paper, we demonstrate an MMF speckle Stokes polarimeter. Multiple MMF speckles were obtained by changing input SOPs. We employed a CNN to efficiently establish a correlation between SOP and speckle intensity distribution. The system does not require optical alignment and laborious microstructure design. The MMF mitigates system complexity and cost and enables applicability for different wavelengths. The CNN excludes environmental impacts, thereby enhancing efficiency and flexibility. For applications related to polarization, the proposed method has significant value.
Sign up for Advanced Photonics Nexus TOC. Get the latest issue of Advanced Photonics Nexus delivered right to you!Sign up now
2 Principle
The distribution of light intensity emitted from the MMF can be explained by Eq. (1), which is a result of different modes of coupling.32 In Eq. (1), the amplitude and complex phase of the
After obtaining speckles related to SOPs from MMF,26 a CNN is employed to establish a mapping relationship between them. The reason for using a CNN is its wide range of applications in image classification and segmentation.34,35 Research has demonstrated the effectiveness of CNN in complex nonlinear modeling and classification tasks for detecting intensity within MMF transmission systems.30,36 Furthermore, this approach eliminates the requirement for additional reference structures and solves the problems associated with minor temperature drift in MMF transmission.14 Therefore, the subsequent task is to denote the SOPs as CNN labels,
Most optical instruments have difficulty in the measurement of high-frequency complex-valued electric and magnetic fields directly.32 To accurately and comprehensively describe the polarization state of light in measurable quantities, Stokes introduced the Stokes parameters (or Stokes vectors)
![]()
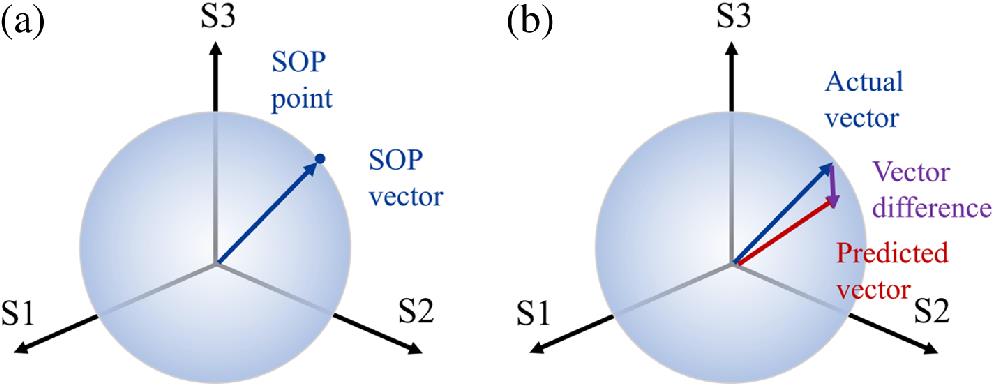
Figure 1.(a) SOP with known Stokes parameters can be equated to a point on a sphere of radius
During the measurement process, there is a natural discrepancy between the predicted and actual vectors, as depicted in Fig. 1(b). The root-mean-square error (RMSE) is often used as a criterion for the estimation accuracy of this discrepancy.39 Thus it can act as the loss function of the CNN. Though
3 Experimental Setup
The experimental setup is shown in Fig. 2. The wavelength of the laser is 1550 nm. MMF (SI 105/125-22/250, YOFC) has a core diameter of
![]()
Figure 2.Scheme of the experimental setup for SOP adjustment and speckle collection.
![]()
Figure 3.(a) MPC contains two individually rotatable quarter-wave plates. (b) The speckle patterns with different SOPs are captured by CCD, and the corresponding Stokes parameters are shown under the speckles.
The image size of the speckle after cropping is
![]()
Figure 4.Structure of CNN mapping SOP to speckle.
4 Results and Discussion
4.1 Stokes Parametric Measurement
Investigating the capability of the system required an SOP data set covering the full Poincaré sphere. We regulated the SOP through MPC adjustment with a rotational angle of 4.5 deg (20 steps). Two quarter-wave plates rotated from 0 to 225 deg individually and 2600 images were collected as a group, resulting in an SOP distribution traversing the entire Poincaré sphere. It should be noted that although the rotation of the MPC increases linearly, its impact on the Mueller matrix is nonlinear. Therefore, some SOPs in the data set were sparse, while others were dense. The data were subjected to a filtering process with the objective of achieving a more uniform distribution across the sphere, which is presented in Fig. 5(a). To eliminate environmental impact, 16 groups of SOPs that covered the entire Poincaré sphere were collected. The data set was divided into a training set, validation set, and test set at an 8:1:1 ratio. In order to evaluate the ability of CNN to predict unknown SOPs, there is no overlap between SOPs in the sets mentioned above. Following the training process, the network generated an RMSE value of 0.0602, which represents the magnitude of the Stokes vector difference between the predicted and actual SOP vectors. For clarity, a distribution function of the loss in the test data set is presented in Fig. 5(b), whereas the RMSE of each point is shown in three-dimensional form in Fig. 5(c). RMSEs of the four Stokes parameters in the test data set are 0.0189, 0.0783, 0.1076, and 0.0694. It should be noted that although
![]()
Figure 5.Data set of SOPs with a rotation step size of 20 and covering the entire Poincaré sphere. (a) Distribution of SOPs on the Poincaré sphere. (b) Distribution of RMSEs related to SOPs. (c) The RMSEs corresponding to points in the test set. (d) Comparison of actual and predicted Stokes parameters.
To investigate the influence of polarization range on prediction accuracy, we extracted a partial data set from the global data set, consisting of
![]()
Figure 6.Data set of SOPs with a rotation step size of 20 covering part of the Poincaré sphere. (a) Distribution of SOPs on the Poincaré sphere. (b) Distribution of RMSEs related to SOPs. (c) The RMSEs corresponding to points in the test set. (d) Comparison of actual and predicted Stokes parameters.
4.2 High-Precision Measurement
To improve the estimation accuracy, we reduced the MPC rotation interval to generate denser-distribution data sets of SOPs. The MPC rotation increments are set at 1, 5, 10, and 20 (0.225, 1.125, 2.250, and 4.500 deg). We have demonstrated the accuracy similarity with a step size smaller than 20. Therefore, for each interval, 10 sets of
![]()
Figure 7.Distribution of SOP data sets on the Poincaré sphere corresponding to different MPC rotation steps: (a) 1 step, (b) 5 steps, (c) 10 steps, and (d) 20 steps.
Table 1 shows the outcomes for each network. By reducing the MPC rotational angle, the interval between adjacent SOP vectors is diminished, resulting in a more uniform and dense SOP distribution, thus enhancing the measurement precision. The RMSEs are smaller than the corresponding vector difference. Figure 8 depicts the RMSE distribution functions of test data sets, whereas Fig. 9 presents the loss distribution in 3D structure for test data sets with diverse MPC rotation steps. The concentration of the loss distribution increases, and the mean value decreases as the MPC rotation angle decreases, indicating accuracy improvement through training data optimization. Furthermore, as the data set distribution becomes denser and the distribution of neighboring SOPs becomes more linear, the likelihood of sudden large RMSEs decreases, increasing the reliability of measurement. Figure 10 compares the Stokes parameters of 30 selected SOPs in the test data sets, further illustrating that using data with smaller vector difference intervals increases accuracy. The results obtained in experiments were considerably lower than the stated accuracy. It should be noted that with an MPC rotation step size of 1 (0.225 deg), the variations in vector values among different SOPs are minor, and the RMSE is 0.0042. The RMSEs for the four Stokes parameters are 0.0021, 0.0043, 0.0050, and 0.0028, correspondingly. The system measures the four Stokes parameters with similar accuracy and is well-balanced in its sensitivity to each value. This limitation in accuracy is due to the minimum rotation angle of the quarter-wave plate in the MPC. It reveals that the system is capable of achieving highly precise SOP measurements.
| MPC Rotational Steps | 1 | 5 | 10 | 20 |
| MPC rotation angle interval (deg) | 0.225 | 1.125 | 2.250 | 4.500 |
| Vector difference | 0.0115 | 0.0573 | 0.1091 | 0.2015 |
| RMSE | 0.0042 | 0.0082 | 0.0133 | 0.0658 |
| Precision of | 0.0021 | 0.0032 | 0.0091 | 0.0189 |
| Precision of | 0.0043 | 0.0091 | 0.0144 | 0.0783 |
| Precision of | 0.0050 | 0.0086 | 0.0142 | 0.1076 |
| Precision of | 0.0028 | 0.0063 | 0.0068 | 0.0694 |
Table 1. RMSEs of test data sets with different MPC rotational steps.
![]()
Figure 8.RMSE distribution of SOPs in test sets with different MPC rotation steps: (a) 1 step, (b) 5 steps, (c) 10 steps, and (d) 20 steps.
![]()
Figure 9.Loss of SOPs in test sets on the Poincaré sphere corresponding to different MPC rotation steps. SOPs are randomly selected and do not overlap with the training or validation sets. (a) 1 step, (b) 5 steps, (c) 10 steps, and (d) 20 steps.
![]()
Figure 10.Comparison of actual and predicted Stokes parameters in test data sets with different MPC rotation steps. (a) 1 step, (b) 5 steps, (c) 10 steps, and (d) 20 steps.
4.3 Applicability with Different Wavelengths
Wavelength influences the intensity distribution of speckles.25 As depicted in Fig. 11(a), the speckles have different intensity distributions with the same SOP at different wavelengths. Therefore, it is imperative to assess the system for its applicability to different wavelengths. Since the measurement principle of the system is similar at different wavelengths and the resolution is mainly related to SOP distribution density, a 10 nm spectral band is used to verify wavelength applicability, and the MPC rotation increment was set at 80 (18 deg). The laser emits light at a single wavelength, ranging from 1545 to 1555 nm in increments of 0.5 nm. And
![]()
Figure 11.Test data sets include SOPs with a rotation step size of 80, covering the entire Poincaré sphere. The wavelength interval is 0.5 nm with a bandwidth of 10 nm. (a) The speckles with the same SOP of [1.022465, −0.6899, −0.2947, and 0.6608] at different wavelengths. (b) The distribution of SOPs with different wavelengths. (c) RMSEs of SOPs in the test data sets corresponding to different wavelengths.
5 Conclusion
In this paper, we proposed and demonstrated an MMF speckle Stokes polarimeter. The MMF is employed to generate specific speckle patterns with specified SOPs, while a CNN is utilized to establish a mapping relationship between them. We demonstrate the polarized optical Stokes parametric measurement capability of the system. The system can achieve a minimum RMSE of 0.0042. The RMSEs for the Stokes parameters in this case are 0.0021, 0.0043, 0.0050, and 0.0028, respectively. The system currently performs highly precise single-point polarized optical Stokes parameter measurements at different wavelengths. It enables a low-cost and straightforward Stokes polarimeter that provides great value for polarization-related applications. Also, it has the potential to be used for full Stokes parameter and polarization measurements of complex optical fields in the future.
Yuxuan Xiong received her BS degree from Huazhong University of Science and Technology (HUST), Wuhan, China, in 2021. She is currently working toward her PhD at the School of Optical and Electronic Information, HUST, Wuhan, China. Her current research interests include multimode fiber, fiber sensors, and optoelectronic systems.
Ting Jiang received her BEng degree in telecommunications engineering from Beijing University of Posts and Telecommunications (BUPT), Beijing, China, in 2020. Since 2020, she has been working toward her PhD at the School of Optical and Electronic Information, HUST, Wuhan, China. Her research interests include optical performance monitoring, machine learning, and digital signal processing.
Hao Wu received his BS, MS, and PhD degrees from HUST, Wuhan, China, in 2013, 2016, and 2019, respectively. His postdoctoral research at HUST was focused on the machine learning algorithms for distributed optical fiber sensing. Since 2024, he has been a research associate at HUST. His current research interests are the integration of artificial intelligence and optical fiber.
Zheng Gao received his BEng degree from the School of Optical and Electronic Information, HUST, Wuhan, China. Since 2020, he has been working toward his PhD at the School of Optical and Electronic Information, HUST, Wuhan, China. His current research interests include multimode fiber and fiber optics sensing.
Shaojun Zhou received his BS degree from Hubei University of Technology, Wuhan, China, in 2021 and his MD degree from HUST, Wuhan, China, in 2024.
Zhao Ge received his BS degree from Jianghan University, Wuhan, China, in 2019 and his MD degree from HUST, Wuhan, China, in 2022. He is currently working toward a PhD at the School of Optical and Electronic Information, HUST, Wuhan, China.
Siqi Yan received his BS and PhD degrees in optics engineering from HUST in 2013 and 2018, respectively. From 2019 to 2021, he worked as a postdoctoral researcher in the Silicon Photonics for Optical Communications Center at the Technical University of Denmark. In November 2021, he joined the HUST as an associate professor. His primary research interests are high-performance silicon/graphene integrated optoelectronics chips and their applications in optical communication systems.
Ming Tang received his BEng degree from HUST in 2001 and his PhD from Nanyang Technological University, Singapore, in 2005. His postdoctoral research at the Network Technology Research Centre was focused on the optical fiber amplifier. From 2009, he was a research scientist in the Tera-Photonics Group, RIKEN, Japan. Since 2011, he has been a professor at HUST. His current research interests include optical fiber-based linear and nonlinear effects for communication and sensing applications.
References
[4] D. H. Goldstein. Polarized Light(2017).
[9] F. Ding, Y. Chen, S. Bozhevolnyi. Metasurface-based polarimeters. Appl. Sci., 8, 594(2018).
[11] F. Alhassen et al. All-fiber acousto-optic polarization monitor. Opt. Lett., 32, 841(2007).
[32] M. P. Mengüç, P. Yang, J. Ding, M. Francoeur, G. W. Kattawar. Maxwell’s equations for single-scattering partiles. Light, Plasmonics and Partiles, 21-42(2023).
[39] H. Hu, T. Liu, X. Li. Measurement and Imaging Processing of Polarization Information(2022).


Set citation alerts for the article
Please enter your email address

© Copyright 2018-2021 | Chinese Laser Press. All Rights Reserved 沪ICP备15018463号-20