
Heyun Tan, Junwei Zhang, Jingyi Wang, Songnian Fu, Siyuan Yu, Xinlun Cai, "High-linearity wide-bandwidth integrated thin-film lithium niobate modulator based on a dual-optical-mode co-modulated configuration," Photonics Res. 13, 817 (2025)
- Photonics Research
- Vol. 13, Issue 4, 817 (2025)
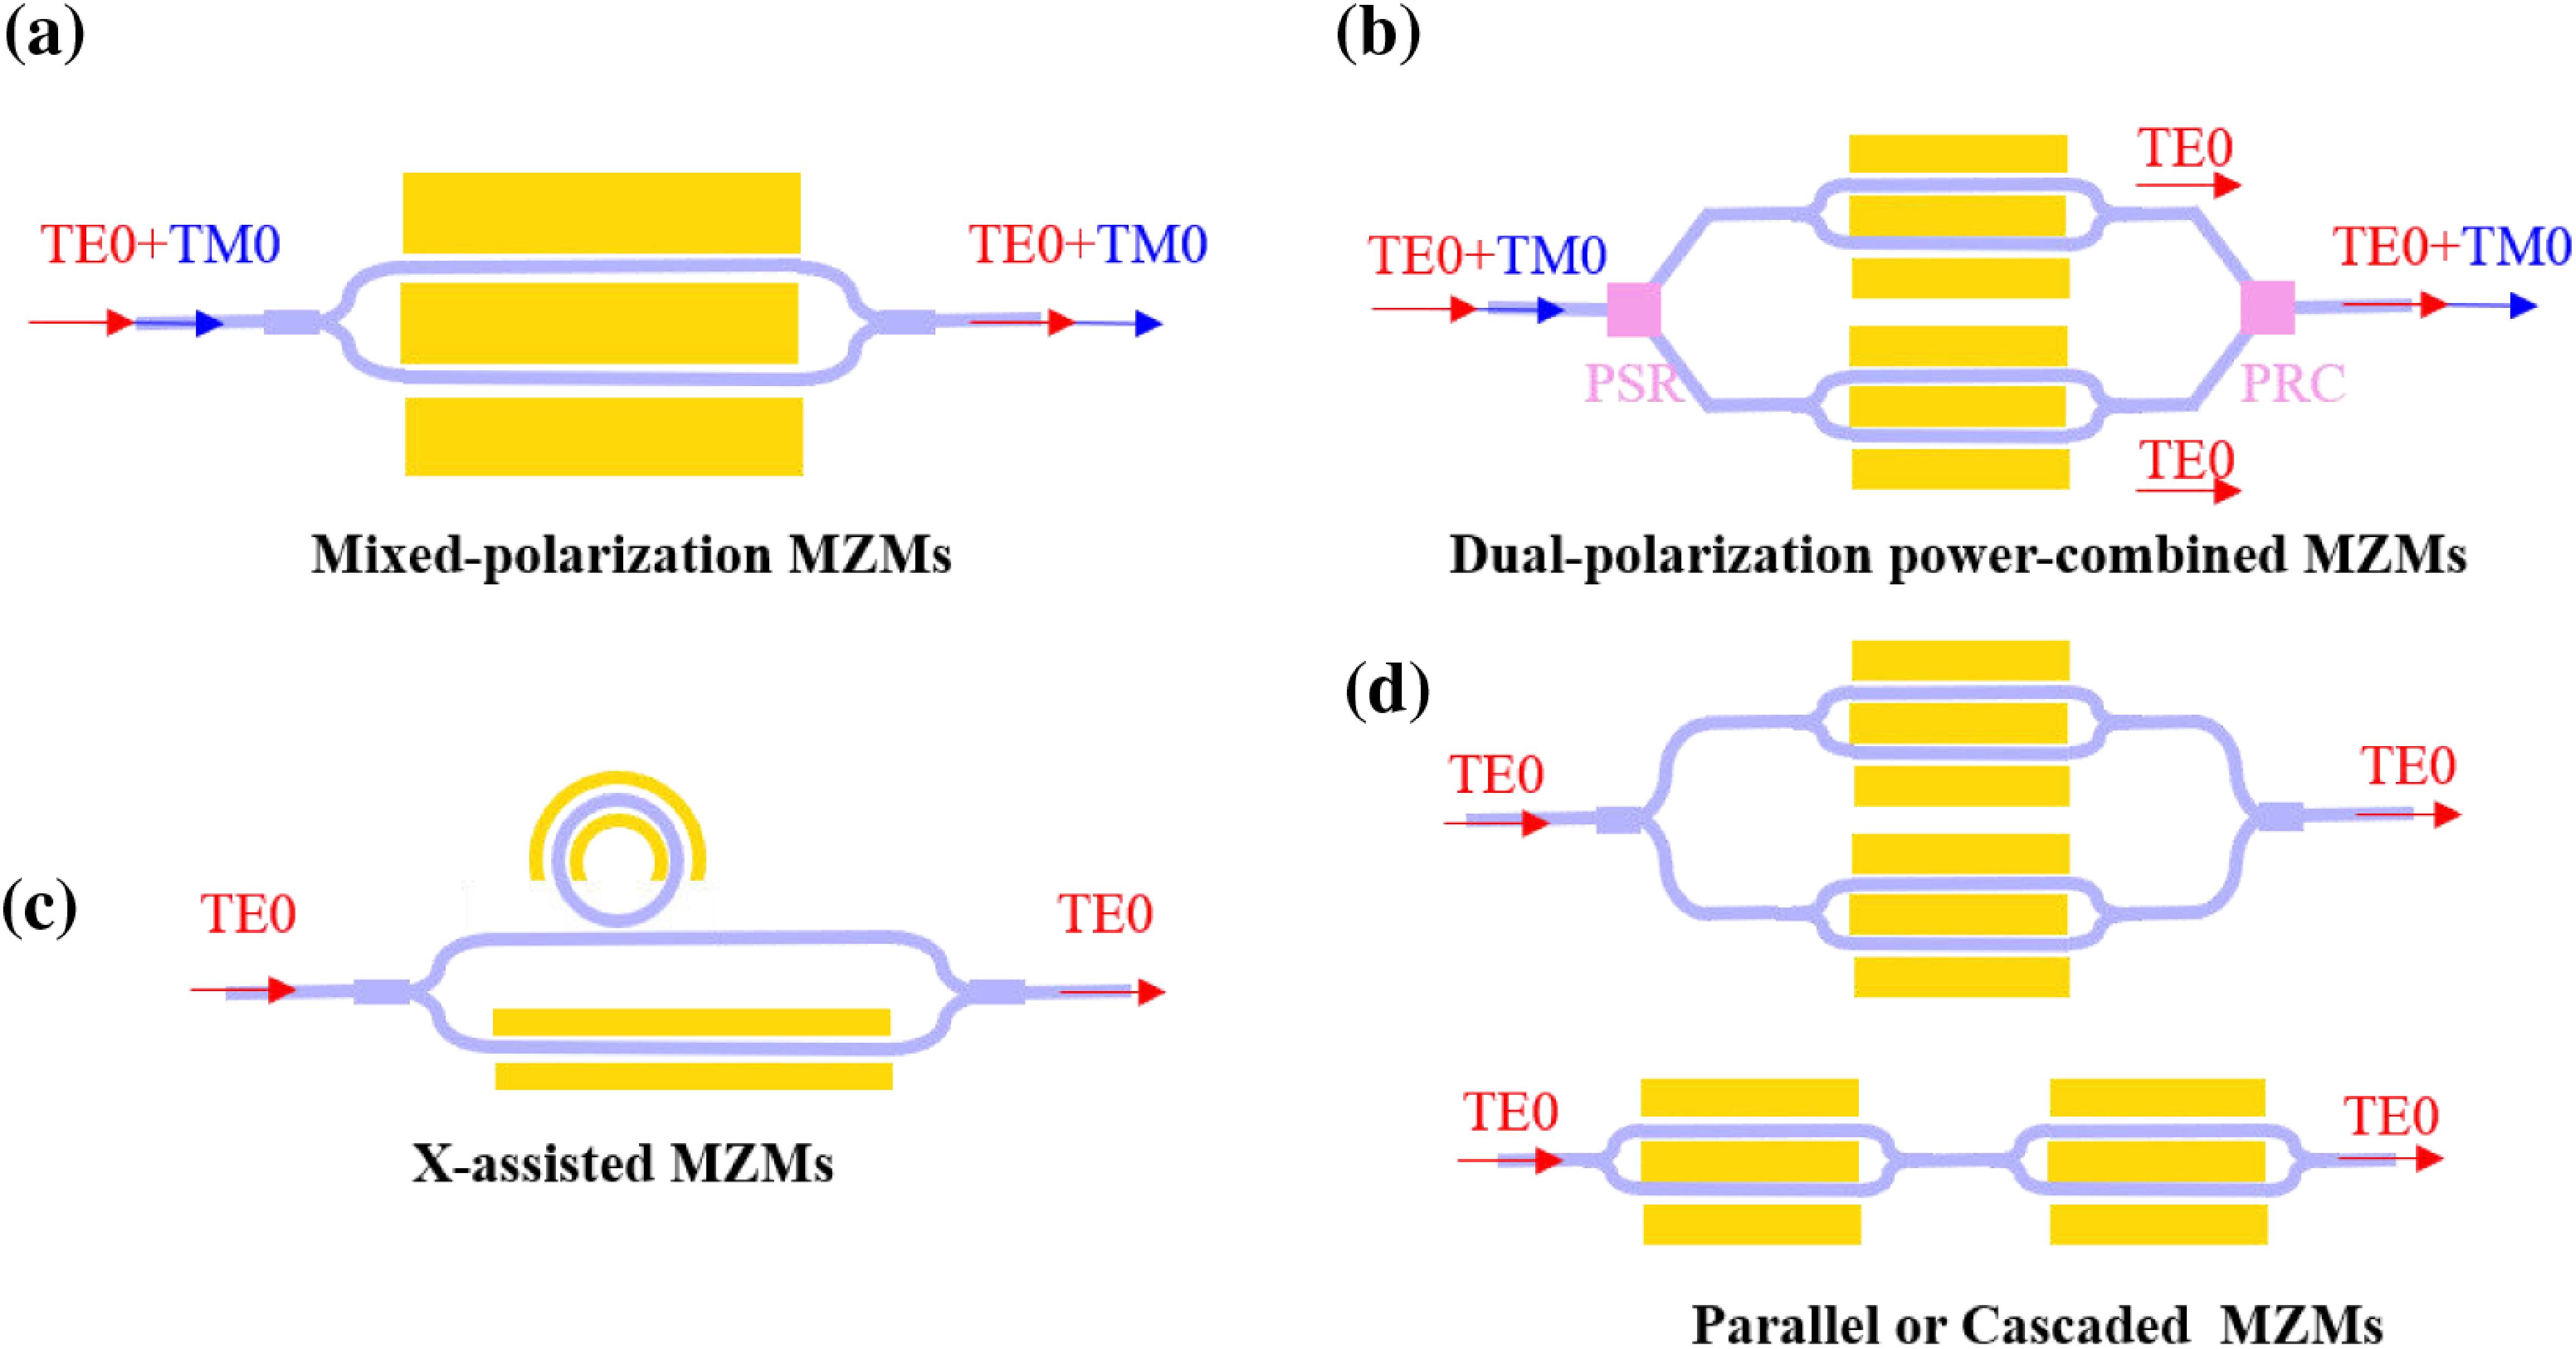
Fig. 1. Schematic diagrams of various linearization strategies: (a) mixed-polarization Mach–Zehnder modulators (MZMs); (b) dual-polarization power-combined MZMs; (c) X-assisted MZMs (where X represents a new structure, such as a ring or a racetrack); (d) parallel or cascaded MZMs. PSR: polarization splitter rotator; PRC: polarization rotator combiner.

Fig. 2. (a) Schematic of the proposed linear Mach–Zehnder modulator (LMZM) based on thin-film lithium niobate (TFLN) photonics. The on-chip optical processing consists of five main steps. (b) Top view of the proposed LMZM, showing several building blocks such as edge couplers, an optical power splitter, 2 × 2
Fig. 3. (a)–(d) Simulated output RF power (signal and IMD3) as a function of the input RF power for both the LMZM and the reference CMZM at optical powers (OPs) of 10, 5, 0, and − 5 dBm V π R
Fig. 4. (a) Microscope image of the fabricated device. (b) Measured small-signal EO responses S 21 V π 2 (b). (g) Measured optical power ratio R 2 (b).
Fig. 5. (a) Schematic of the setup for SFDR measurements. EDFA: erbium-doped fiber amplifier; PC: polarization controller; DUT: device under test; EPC: electrical power combiner; ESA: electrical spectrum analyzer. (b) Image of the DUT. (c) Image of the experimental setup for SFDR measurements. (d)–(f) Measured output RF powers of the signal and IMD3 as functions of input RF power at different OPs, using two frequencies at 1 GHz and 1.01 GHz, with OPs of about 5.5 dBm, 0.1 dBm, and − 4.7 dBm
Fig. 6. (a)–(c) Measured output RF powers of the signal and IMD3 as a function of input RF power for the LMZM, TE0-MZM, and TE1-MZM under close power conditions (∼ 0 dBm
Fig. 7. (a)–(e) Measured output RF powers of the signal and IMD3 as a function of input RF power for the LMZM and CMZM at various frequency pairs F F + 0.01 GHz F = 1
Fig. 8. (a) Simulated SFDR as a function of the optical ratio R
|
Table 1. Comparison of Various Linearization Strategies in Optical Domain


Set citation alerts for the article
Please enter your email address

© Copyright 2018-2021 | Chinese Laser Press. All Rights Reserved 沪ICP备15018463号-20