
Han Gao, Haifeng Hu, Qiwen Zhan. Tailoring temperature response for a multimode fiber[J]. Opto-Electronic Science, 2025, 4(1): 240004
- Opto-Electronic Science
- Vol. 4, Issue 1, 240004 (2025)
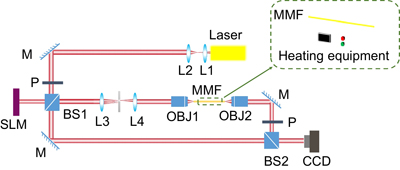
Fig. 1. Schematics of the experimental setup. OBJ: microscopic objective (OBJ1: 20×, NA (numerical aperture) = 0.40; OBJ2: 40×, NA= 0.75); CCD: charge-coupled device camera; MMF: multimode fiber; SLM: spatial light modulator; P: polarizer; M: mirror; BS: beam splitter; L: lens.

Fig. 2. Calculated correlation function for output signals of the unmodulated wavefront (blue solid line), the temperature principal mode (red solid line) and the temperature anti-principal mode (green solid line).
Fig. 3. Recorded intensity profiles of (a ) temperature principal mode (top row), (b ) temperature anti-principal mode (middle row) and (c ) unmodulated wavefront (bottom row) at the distal end of the fiber.
Fig. 4. Normalized bandwidth of the temperature principal mode and the temperature anti-principal mode for different fiber length.
Fig. 5. Overview of learning empowered fiber specklegram temperature sensing schemes based on temperature anti-principal mode sensitization.
Fig. 6. The contribution rate and cumulative contribution rate of principal components under different dimensions.
Fig. 7. The trained deep learning model is used to predict learned configurations. (a , b ) Prediction error and error distribution histogram of a fiber specklegram temperature sensor with unmodulated wavefront. (c , d ) The prediction error and error distribution histogram of the fiber specklegram temperature sensor sensitized by the temperature anti-principal mode.
Fig. 8. The trained deep learning model is used to predict unlearned configurations. (a , b ) Prediction error and error distribution histogram of a fiber specklegram temperature sensor with unmodulated wavefront. (c , d ) The prediction error and error distribution histogram of the fiber specklegram temperature sensor sensitized by the temperature anti-principal mode.
Fig. 9. The performance of fiber specklegram temperature sensors based on temperature principal modes. (a , b ) Prediction errors and error distribution histograms for learned configurations. (c , d ) Prediction errors and error distribution histograms for unlearned configurations.
| ||||||||||||||||||||||
Table 1. Objective evaluation parameters of the different transform domain fusion methods.


Set citation alerts for the article
Please enter your email address

© Copyright 2018-2021 | Chinese Laser Press. All Rights Reserved 沪ICP备15018463号-20