• Infrared and Laser Engineering
  • Vol. 54, Issue 2, 20240455 (2025)
Jing HE1,2, Quancheng LIU3, Zhonggang XIONG4, and Linyu CHEN1,2,*
Author Affiliations
  • 1School of Information Engineering, Mianyang Teachers' College, Mianyang 621000, China
  • 2Key Laboratory of IOT Security at Mianyang Teachers' College of Sichuan Province, Mianyang 621000, China
  • 3School of Information Engineering, Southwest University of Science and Technology, Mianyang 621010, China
  • 4School of Mechanical Engineering, Guilin University of Aerospace Technology, Guilin 541004, China
  • show less
    DOI: 10.3788/IRLA20240455 Cite this Article
    Jing HE, Quancheng LIU, Zhonggang XIONG, Linyu CHEN. Determination of copper content in raw ores via laser-induced breakdown spectroscopy with generalized linear model[J]. Infrared and Laser Engineering, 2025, 54(2): 20240455 Copy Citation Text show less
    Schematic of LIBS experimental setup
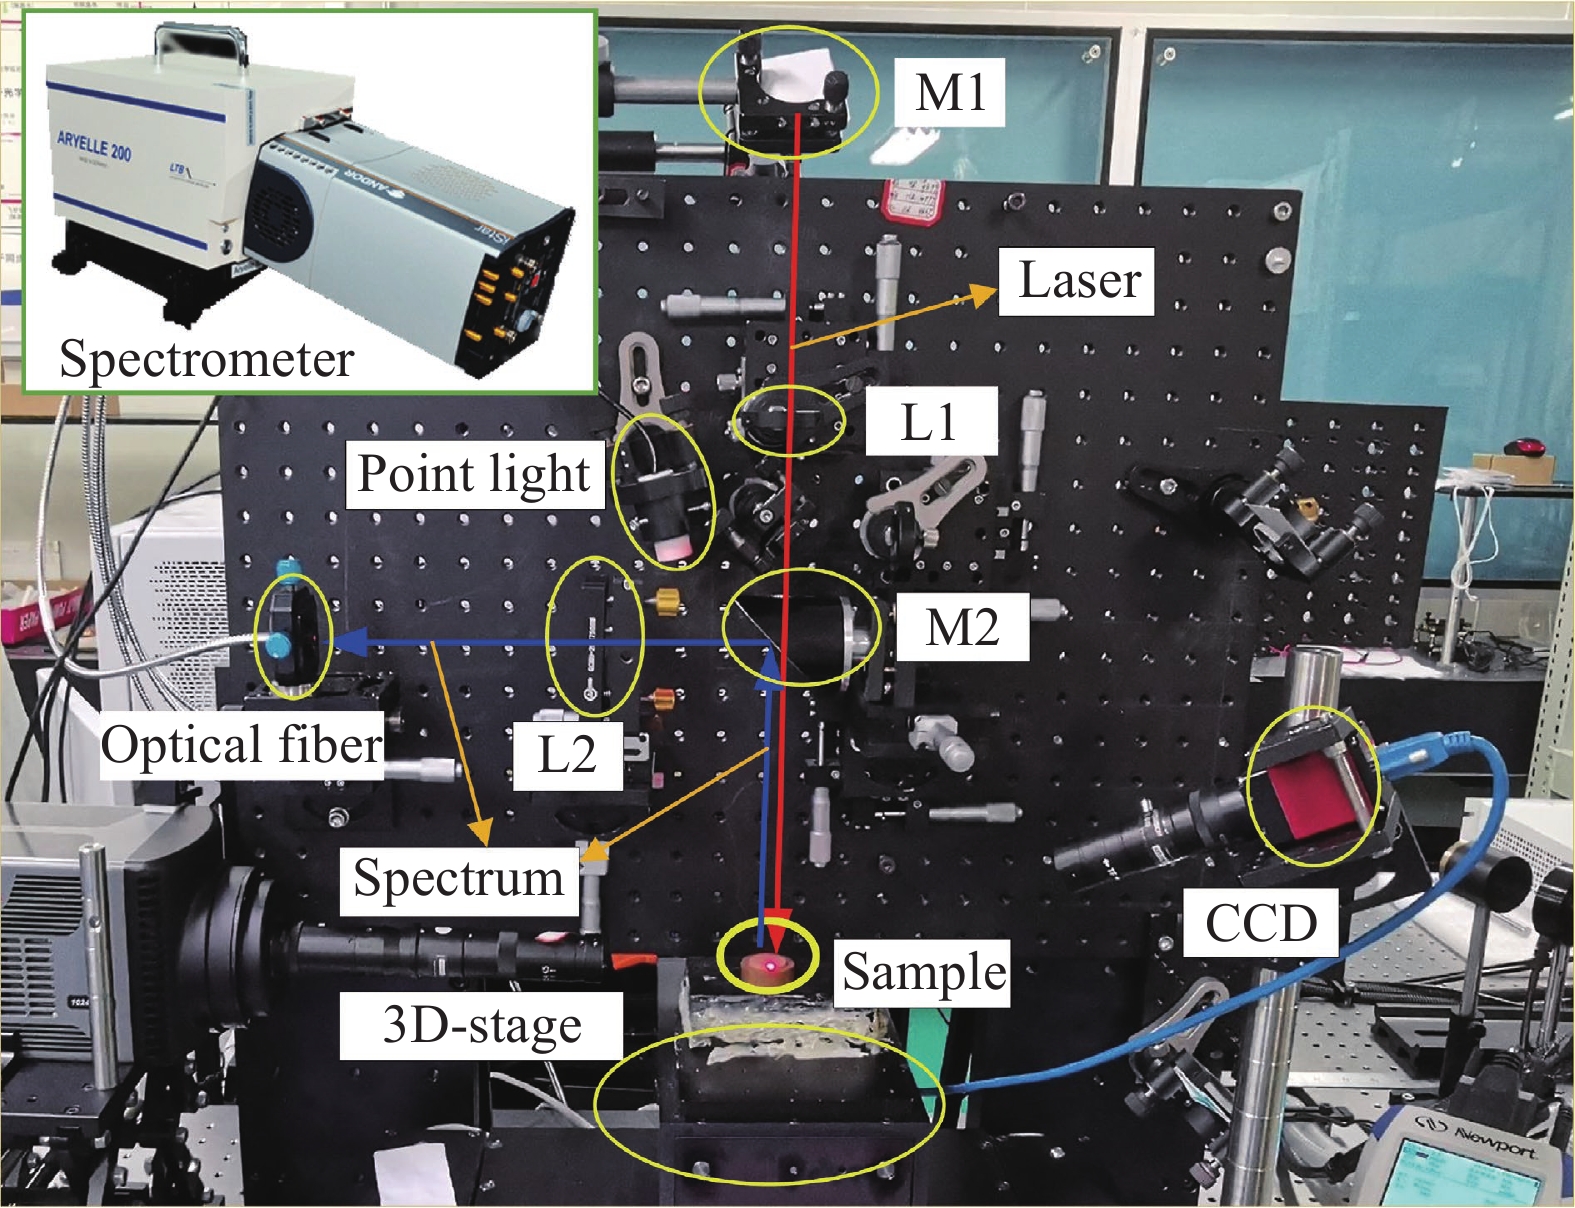
    Fig. 1. Schematic of LIBS experimental setup
    Tablet images of nine kinds of ore/concentrate samples
    Fig. 2. Tablet images of nine kinds of ore/concentrate samples
    Typical spectra of nine kinds of copper ore/concentrate
    Fig. 3. Typical spectra of nine kinds of copper ore/concentrate
    Variation of R2 in the training and test sets with α
    Fig. 4. Variation of R2 in the training and test sets with α
    The number of selected Cu lines with α
    Fig. 5. The number of selected Cu lines with α
    Predicted and validated results of Elastic Net
    Fig. 6. Predicted and validated results of Elastic Net
    TypeSpectrumNo.SamplenameCopper content/wt.%
    Training/validationset1-10GWB(E)073.84
    21-30ZBK3398.46
    31-40ZBK33710.71
    41-50ZBK33612.79
    51-60ZBK34016.60
    71-80ZBK33820.56
    81-90ZBK338 B24.35
    Test set11-20ZBK3356.78
    61-70ZBK340 A18.04
    Table 1. The spectra sets and speciality of copper ore/concentrate
    ModelNumber of variablesTraining setTest set
    R2MSEvMSEpMAPE
    注:1 Information content >95%;2 Linear Kernel,c=44.54,g=0.01;3α=0.296,λ=0.003144λ=0.00656,Linear Kernel,c=91.85,g=0.01;5α=0.08;λ=0.00729,Linear Kernel,c=33.07,g=0.01
    PLSR160.96901.3041.8438.11%
    OLS290.98350.7012.31711.58%
    PSO-SVR2290.97890.8772.49612.55%
    Lasso (λ = 0.00656)210.98010.8311.70610.73%
    Ridge(k = 0.188)290.97920.8601.1808.37%
    Elastic Net3290.97950.8491.2318.56%
    Lasso-PSO-SVR4210.97870.9222.06111.43%
    Elastic Net-PSO-SVR5280.97920.8672.29511.89%
    Table 2. Performance comparison between eight models
    No.Validated oreLassoRidgeElastic NetPLSRLasso-PSO-SVRElastic Net-PSO-SVR
    1GWB(E)070.28450.23310.27510.47260.85890.5887
    2ZBK3390.89110.79980.84721.16412.58063.4203
    3ZBK3370.25780.23150.24360.37560.69670.4848
    4ZBK3360.70530.64970.69870.94652.44793.7488
    5ZBK3400.69740.59430.6581.13582.42042.3746
    6ZBK3380.78170.71330.74761.18952.68551.9875
    7ZBK338B0.80680.73890.77681.24952.44733.0500
    8ZBK3350.87220.77480.82621.27112.85622.8444
    9ZBK340A0.84640.72150.79031.15193.37783.5985
    Mean0.6830.6060.65150.99522.2642.455
    Std. deviation0.2430.2210.230.33740.8941.225
    Tests of normalityStatistic0.7710.7640.7610.7560.8210.877
    Sig. P0.0090.0080.0070.0060.0360.147
    Table 3. Fitting MSE of Leave-one-out method
    No.Validated oreLassoRidgeElastic NetPLSRLasso-PSO-SVRElastic Net-PSO-SVR
    1GWB(E)0767.314557.290456.326260.728968.194063.2958
    2ZBK3391.32772.41261.29471.44911.63201.0263
    3ZBK33752.240351.319252.869264.482747.913353.7357
    4ZBK33613.07868.294511.41428.98230.794036.1303
    5ZBK34028.876725.826923.75131.746226.347731.9675
    6ZBK3387.67853.54965.105112.450813.871213.3334
    7ZBK338B7.495214.749010.677615.386821.066021.2086
    8ZBK3353.54871.57431.37090.36611.44112.5917
    9ZBK340A2.05562.10121.69244.151938.968748.6560
    Mean20.40218.56918.277924.416127.80330.216
    Std. deviation24.11621.7721.800124.340721.76922.38
    Tests of normalityStatistic0.7910.7820.7690.8640.9560.949
    Sig. P0.0160.0130.0090.1070.7560.678
    Table 4. Validation MSE of Leave-one-out method
    Paired groupSig. P
    FittingValidation
    Lasso vs PLSR0.0080.139
    Ridge vs PLSR0.0080.038
    Elastic Net vs PLSR0.0080.015
    Table 5. Paired T-Test
    Jing HE, Quancheng LIU, Zhonggang XIONG, Linyu CHEN. Determination of copper content in raw ores via laser-induced breakdown spectroscopy with generalized linear model[J]. Infrared and Laser Engineering, 2025, 54(2): 20240455
    Download Citation