• Infrared and Laser Engineering
  • Vol. 52, Issue 2, 20220366 (2023)
Zhibiao Zhou, Hui Zhou, Yue Ma, Yue Song, and Song Li
Author Affiliations
  • School of Electronic Information, Wuhan University, Wuhan 430072, China
  • show less
    DOI: 10.3788/IRLA20220366 Cite this Article
    Zhibiao Zhou, Hui Zhou, Yue Ma, Yue Song, Song Li. ICESat-2 lidar sea surface signal extraction and ocean wave element calculation[J]. Infrared and Laser Engineering, 2023, 52(2): 20220366 Copy Citation Text show less
    Point cloud diagram of ATLAS
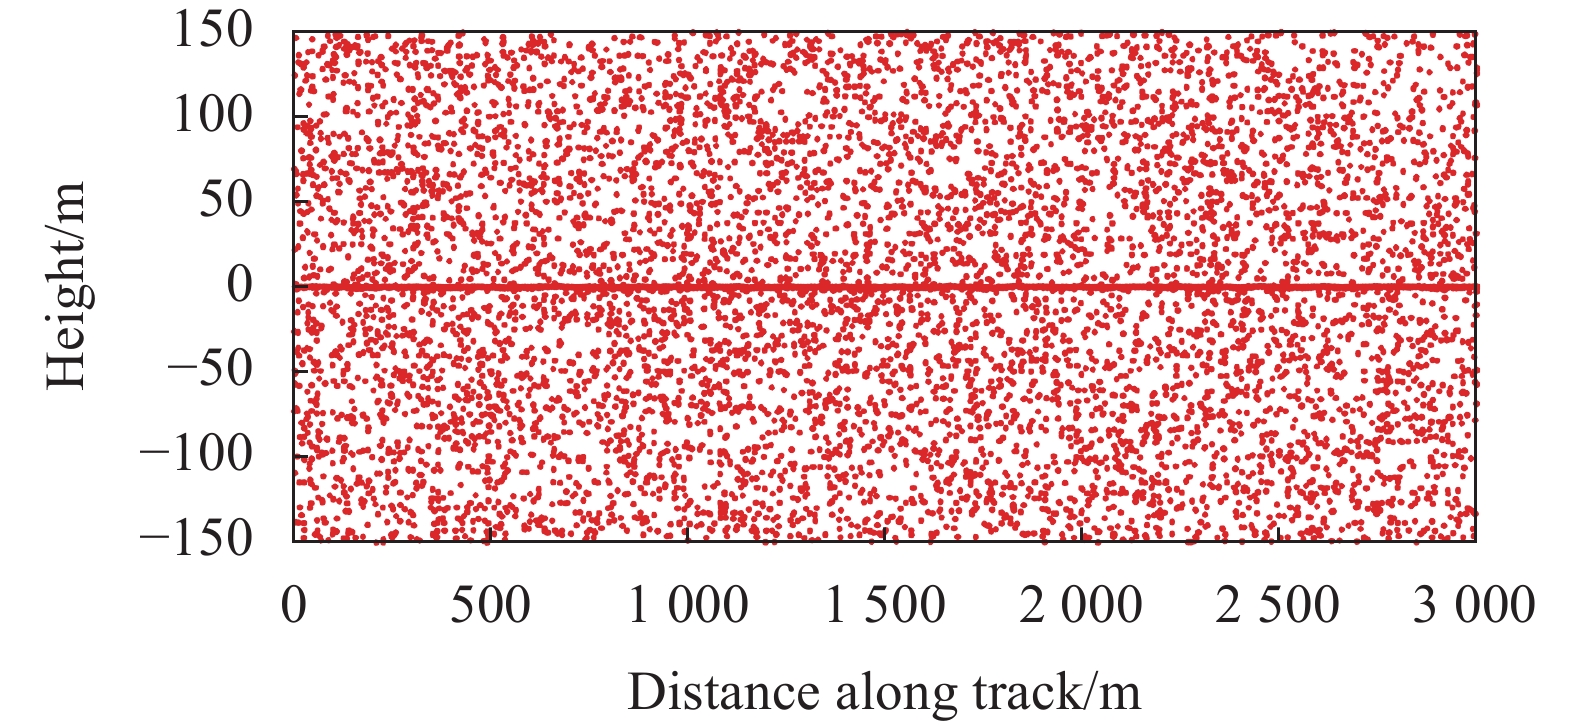
    Fig. 1. Point cloud diagram of ATLAS
    Neighborhood diagram of calculating point density
    Fig. 2. Neighborhood diagram of calculating point density
    Flow chart of sea surface signal extraction
    Fig. 3. Flow chart of sea surface signal extraction
    Point cloud diagram after rough extraction
    Fig. 4. Point cloud diagram after rough extraction
    Point cloud diagram after refined extraction
    Fig. 5. Point cloud diagram after refined extraction
    The sea surface signal extraction results: the red points are the original point clouds, and the black points are the sea surface signal points extracted by the method in this paper. (a1) Daytime original point cloud; (a2) Extracted result of daytime point cloud; (b1) Nighttime original point cloud; (b2) Extracted result of nighttime point cloud
    Fig. 6. The sea surface signal extraction results: the red points are the original point clouds, and the black points are the sea surface signal points extracted by the method in this paper. (a1) Daytime original point cloud; (a2) Extracted result of daytime point cloud; (b1) Nighttime original point cloud; (b2) Extracted result of nighttime point cloud
    (a) Result of obtaining the sea surface profile; (b) Enlarged view of the blue box area of the obtained result of the sea surface profile
    Fig. 7. (a) Result of obtaining the sea surface profile; (b) Enlarged view of the blue box area of the obtained result of the sea surface profile
    Amplitude-frequency diagram of sea surface profile obtained by FFT transformation
    Fig. 8. Amplitude-frequency diagram of sea surface profile obtained by FFT transformation
    ParametersSite 1Site 2Site 3Site 4Site 5Site 6Site 7
    Longitude (°E)110.79110.63110.59110.66109.72109.75109.79
    Latitude (°N)5.597.257.247.2617.0817.0817.08
    ATLAS beam numbergt2rgt2rgt1rgt1rgt1rgt2rgt3r
    TimeNightNightNightDayDayDayDay
    Water depth/m470190018501880180240300
    Wind speed/m·s−12.02.92.95.65.65.65.6
    Peak period calculated in this paper/s8.20 8.01 8.47 4.10 6.60 6.76 6.60
    ERA5 peak period/s8.108.078.074.486.566.566.56
    Absolute error/s0.10.060.400.380.040.20.04
    Relative error1.2%−0.7%4.9%−8.4%0.6%3.0%0.6%
    Table 1. Parameters and calculation results of the study area
    Signal photon’s sourceSite 1Site 2Site 3Site 4Site 5Site 6Site 7
    Data timeNightNightNightDayDayDayDay
    Calculated by this paper’s method1.20%−0.70%4.90%−8.40%0.60%3.00%0.60%
    Calculated based on ATL03 high confidence data0.37%−4.34%4.96%368.75%0.61%18.29%9.15%
    Table 2. Comparison of peak wave period errors calculated by the method in this paper and the sea surface signal photons extracted with the official ATL03 high confidence data
    Zhibiao Zhou, Hui Zhou, Yue Ma, Yue Song, Song Li. ICESat-2 lidar sea surface signal extraction and ocean wave element calculation[J]. Infrared and Laser Engineering, 2023, 52(2): 20220366
    Download Citation