• Chinese Journal of Lasers
  • Vol. 52, Issue 6, 0611002 (2025)
Xiyuan Cao1,2, Yifan Luo1,2, Yangyang Zhao1,2, Jiaxu Zhang1,2, and Nan Li1,2,*
Author Affiliations
  • 1State Key Laboratory of Dynamic Measurement Technology, North University of China, Taiyuan 030051, Shanxi , China
  • 2School of Instrument and Electronics, North University of China, Taiyuan 030051, Shanxi , China
  • show less
    DOI: 10.3788/CJL241126 Cite this Article Set citation alerts
    Xiyuan Cao, Yifan Luo, Yangyang Zhao, Jiaxu Zhang, Nan Li. Qualitative and Quantitative Analysis of Metals via Remote Laser Induced Breakdown Spectroscopy[J]. Chinese Journal of Lasers, 2025, 52(6): 0611002 Copy Citation Text show less
    Schematic diagram of coaxial optical path structure design
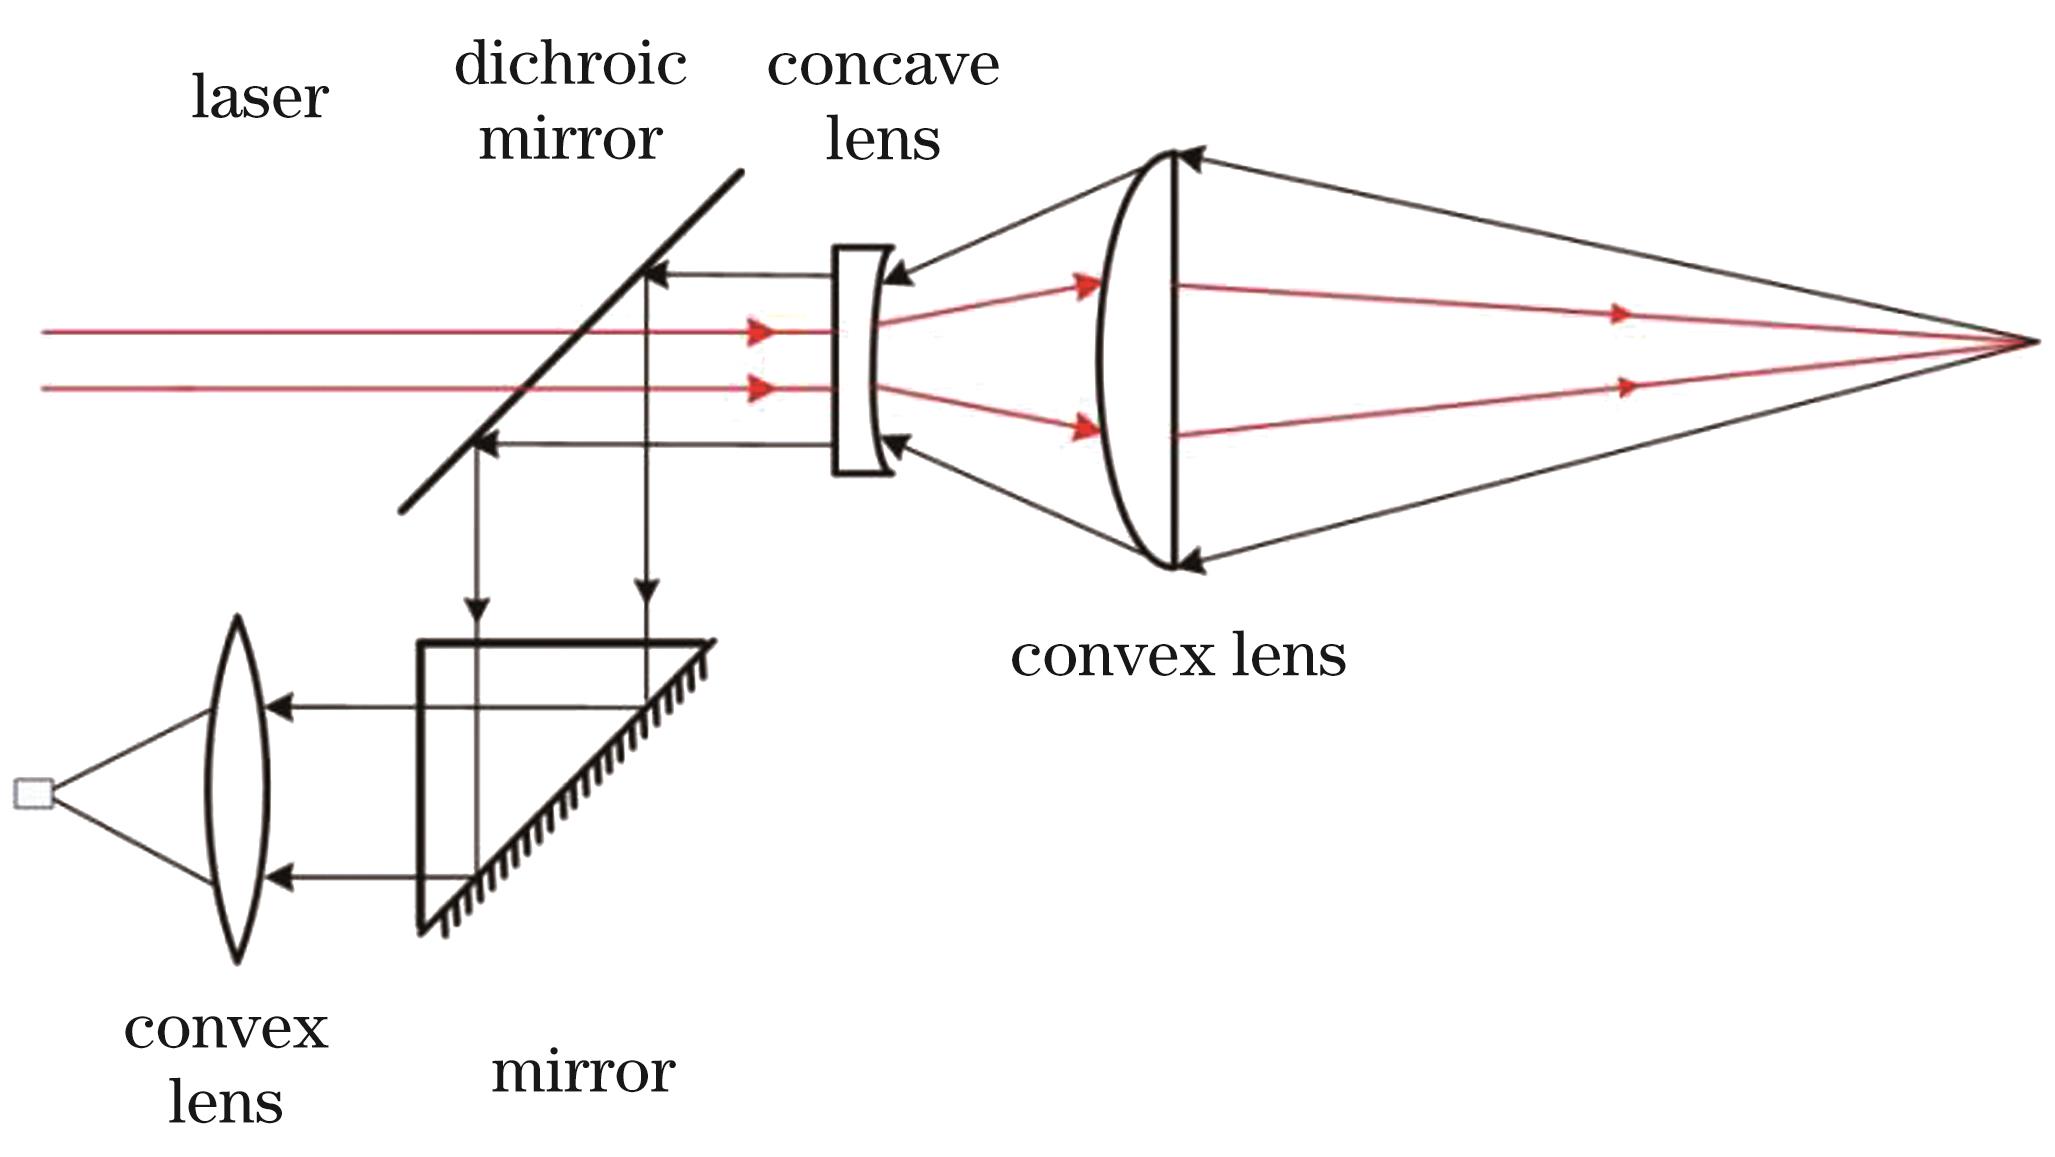
    Fig. 1. Schematic diagram of coaxial optical path structure design
    Simulation results of focusing effect of lens group. (a) Light path simulation diagram; (b) focusing spot diagram
    Fig. 2. Simulation results of focusing effect of lens group. (a) Light path simulation diagram; (b) focusing spot diagram
    Schematic diagram of LIBS remote detection system
    Fig. 3. Schematic diagram of LIBS remote detection system
    Typical LIBS lines of copper-nickel-magnesium-aluminum alloy target
    Fig. 4. Typical LIBS lines of copper-nickel-magnesium-aluminum alloy target
    Spectra of various elements under different detection distances and detection delays. (a) 0 ns; (b) 500 ns; (c) 1000 ns; (d) 2000 ns
    Fig. 5. Spectra of various elements under different detection distances and detection delays. (a) 0 ns; (b) 500 ns; (c) 1000 ns; (d) 2000 ns
    Characteristic spectra of each element under different detection delays when detection distance is 5.0 m
    Fig. 6. Characteristic spectra of each element under different detection delays when detection distance is 5.0 m
    Characteristic spectral intensity of each element versus detection delay. (a) Ni I 352.45 nm; (b) Al I 396.15 nm;
    Fig. 7. Characteristic spectral intensity of each element versus detection delay. (a) Ni I 352.45 nm; (b) Al I 396.15 nm;
    Characteristic spectral intensity versus laser energy under different detection distances. (a) Ni I 352.45 nm; (b) Al I 396.15 nm; (c) Mg I 518.36 nm; (d) Cu I 521.82 nm
    Fig. 8. Characteristic spectral intensity versus laser energy under different detection distances. (a) Ni I 352.45 nm; (b) Al I 396.15 nm; (c) Mg I 518.36 nm; (d) Cu I 521.82 nm
    Detection results of Ni I 352.45 nm, Al I 396.15 nm, Mg I 518.36 nm, and Cu I 521.82 nm at different distances. (a) Spectral lines; (b) spectral intensity versus detection distance
    Fig. 9. Detection results of Ni I 352.45 nm, Al I 396.15 nm, Mg I 518.36 nm, and Cu I 521.82 nm at different distances. (a) Spectral lines; (b) spectral intensity versus detection distance
    Calibration curves of Al under different detection distances. (a) 0.5 m; (b) 1.0 m; (c) 2.0 m; (d) 3.0 m; (e) 4.0 m; (f) 5.0 m
    Fig. 10. Calibration curves of Al under different detection distances. (a) 0.5 m; (b) 1.0 m; (c) 2.0 m; (d) 3.0 m; (e) 4.0 m; (f) 5.0 m

    Focusing

    distance /mm

    Lens

    spacing /mm

    Focusing spot

    radius /μm

    500147.18991.123
    1000112.995129.484
    1500103.797174.782
    200099.523221.284
    250097.054268.214
    300095.446315.342
    350094.315362.575
    400093.477409.878
    450092.831457.223
    500092.317504.593
    Table 1. Relationship among lens spacing, focusing distance, and focusing spot size
    Element

    Wavelength /

    nm

    Aki /s-1Ei /cm-1Ek /cm-1
    Ni I352.451.0×108204.78728569.203
    Al I396.159.85×107112.06125347.756
    Mg I518.365.61×10721911.17841197.403
    Cu I521.827.5×10730783.69749942.051
    Table 2. Ni I, Al I, Mg I, and Cu I spectral line parameters for spectral analysis
    Detection distance /mStandard curve methodMultivariate linear fitting method
    ARE /%RMSERegression equationARE /%RMSE
    0.55.170.530.30285-0.000345479x1+0.000802795x21.780.17
    1.06.080.580.06583+0.000937631x1-0.000847347x22.280.21
    2.06.420.611.20009-0.01632x1+0.02653x22.950.30
    3.06.870.64-0.10877-0.00146x1+0.004466x23.250.38
    4.07.180.67-0.22457-0.00212x1+0.00821x23.410.32
    5.07.410.69-0.50958-0.01475x1+0.02871x23.740.39
    Table 3. Comparison of analysis results between standard curve method and multivariate linear fitting method
    Xiyuan Cao, Yifan Luo, Yangyang Zhao, Jiaxu Zhang, Nan Li. Qualitative and Quantitative Analysis of Metals via Remote Laser Induced Breakdown Spectroscopy[J]. Chinese Journal of Lasers, 2025, 52(6): 0611002
    Download Citation