
Qinfen Huang, Zhiwei Fang, Zhe Wang, Yiran Zhu, Jian Liu, Yuan Zhou, Jianping Yu, Min Wang, Ya Cheng, "On-chip tunable single-mode high-power narrow-linewidth Fabry–Perot microcavity laser on Yb3+-doped thin-film lithium niobate," Photonics Res. 13, 935 (2025)
- Photonics Research
- Vol. 13, Issue 4, 935 (2025)
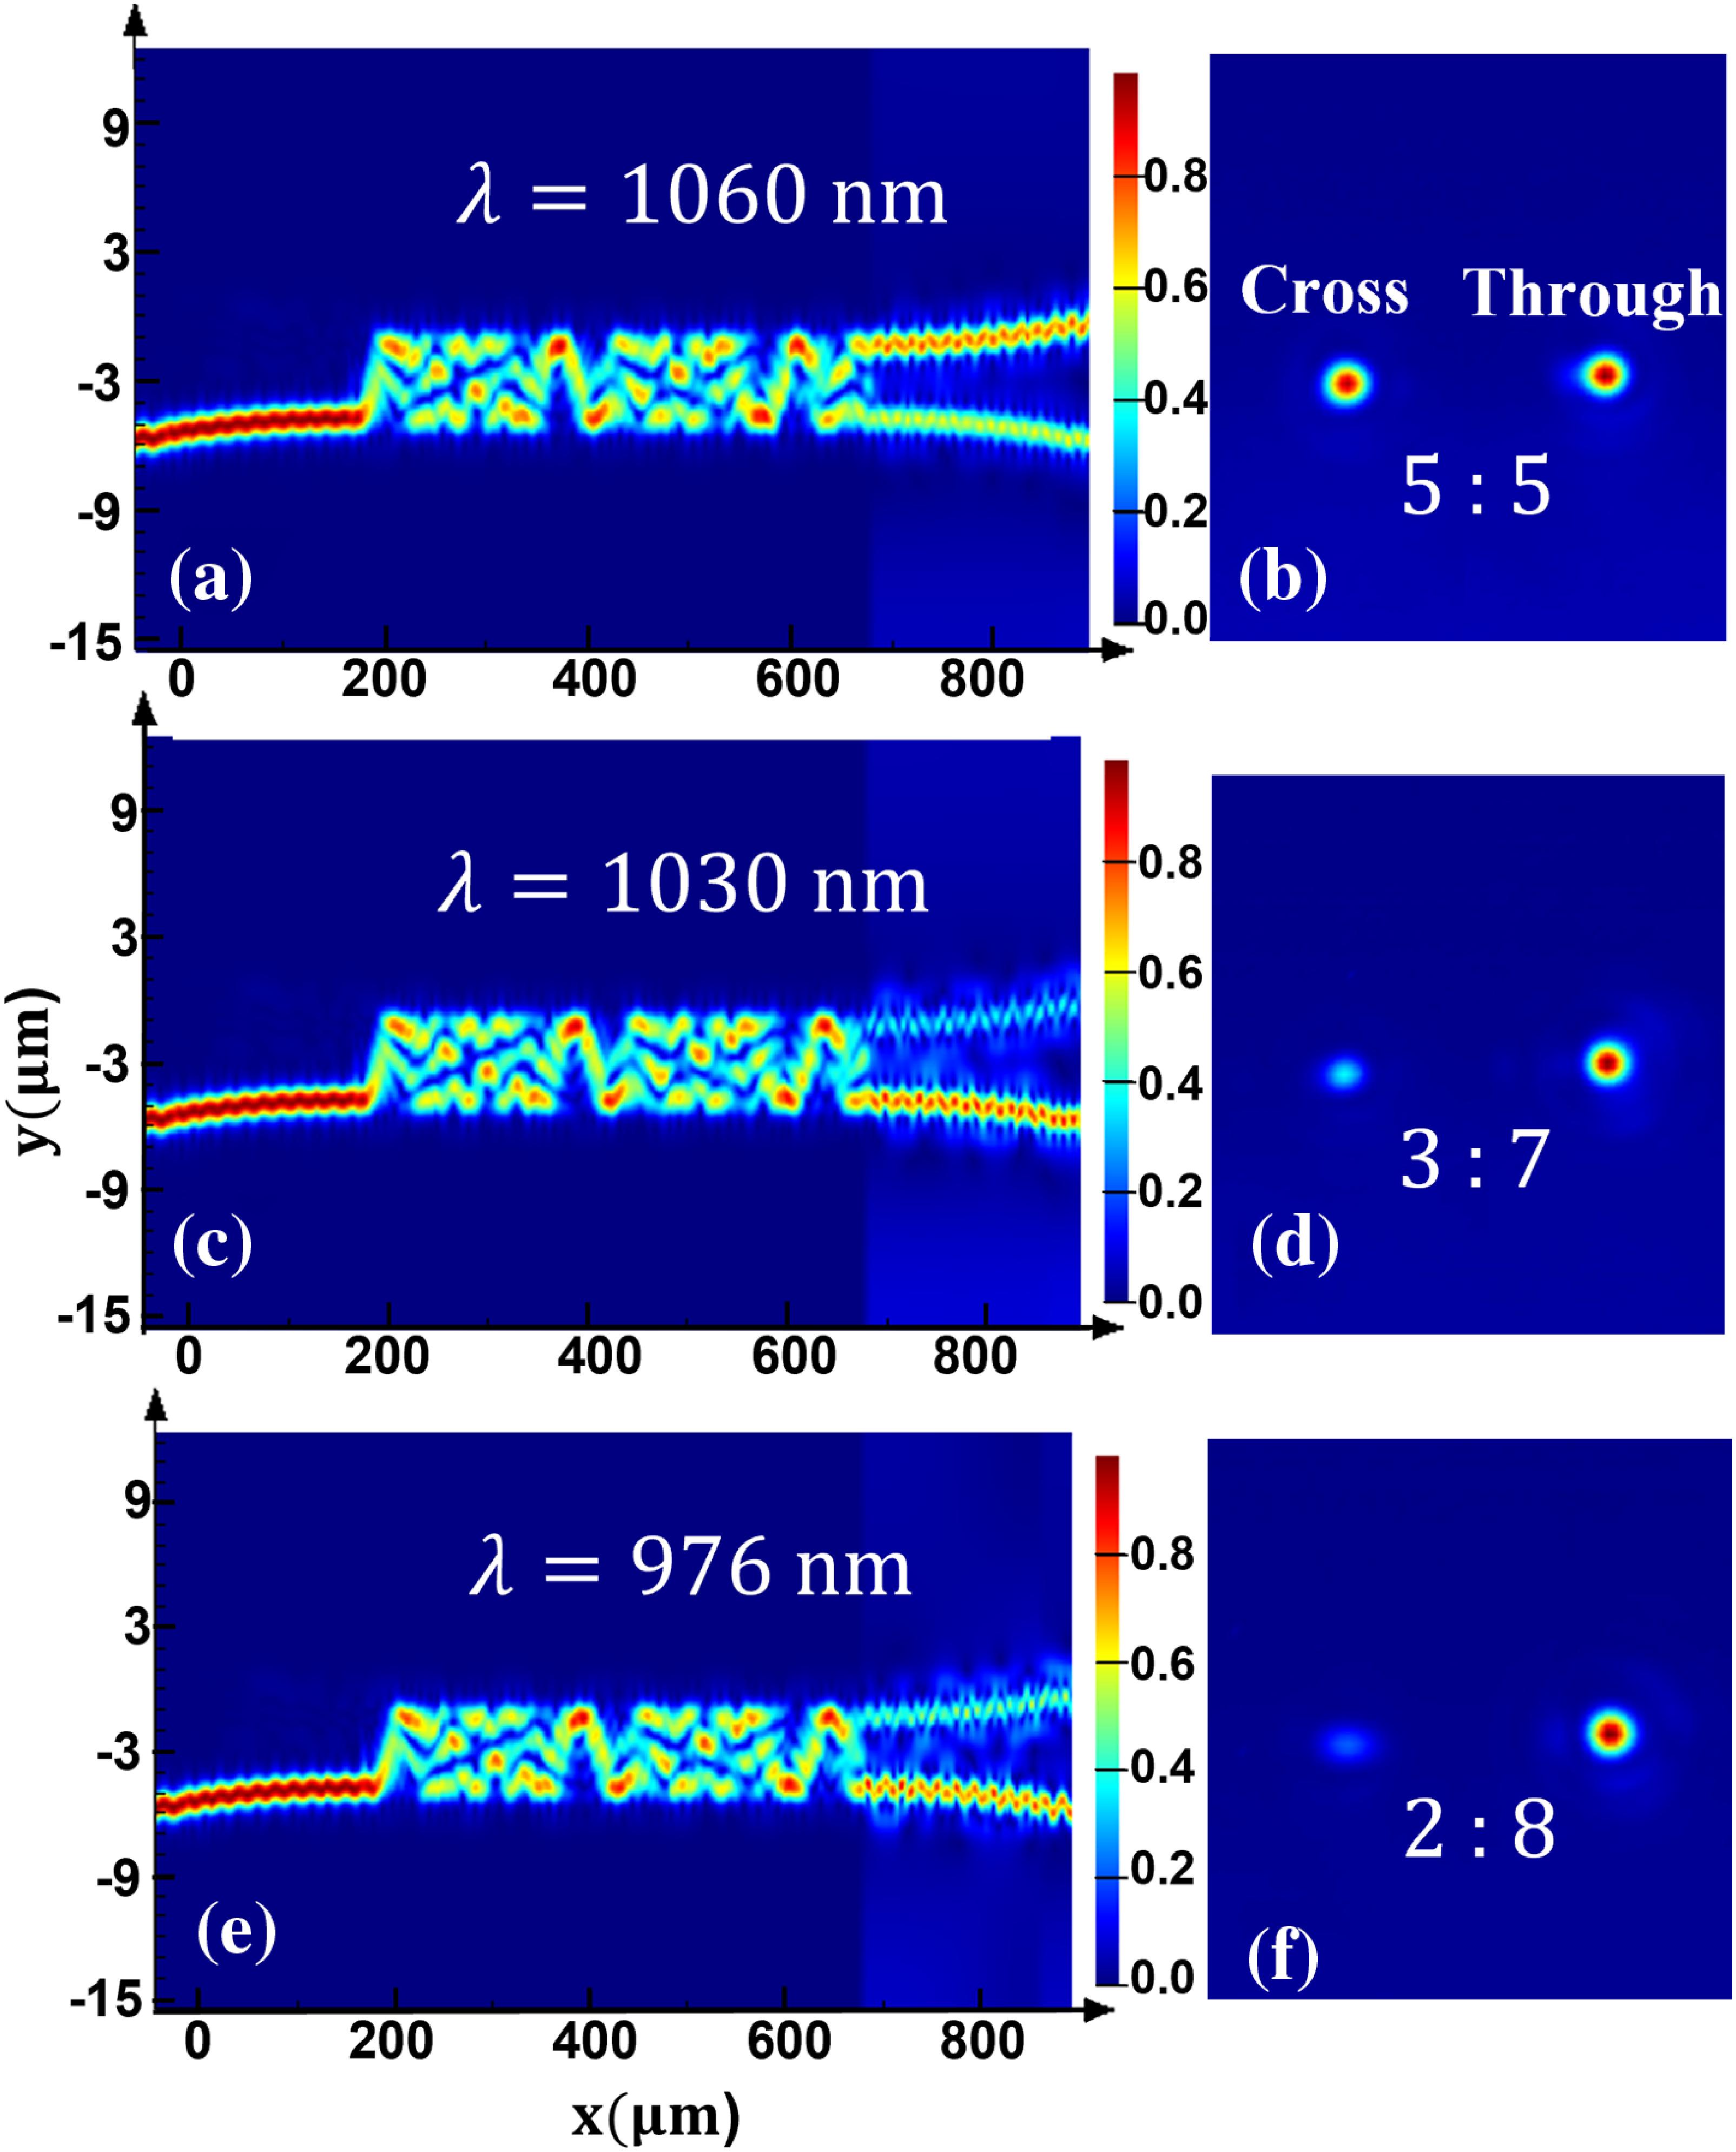
Fig. 1. Simulated mode field distributions of 500 μm × 4.4 μm 2 × 2

Fig. 2. (a) Optical microscope image of a Yb:TFLN FP cavity. (b) Zoomed-in optical microscope images of a complete MMI image that is 500 μm long. (c) Coupling region of the MMI with a width of 4.4 μm. (d) The gap between the two microelectrodes is 10 μm.
Fig. 3. (a) Experimental setup used to characterize the Yb:TFLN FP cavity. The inset shows the energy level diagram of Yb 3 +
Fig. 4. Lasing characterization of the Yb:TFLN FP cavity under a bidirectional pump with two 976 nm pump lasers. (a) Output optical spectrum of the 1030-FP laser from 1000 to 1100 nm. (b) Enlarged spectrum around a wavelength of 1029.6 nm; the lasing peak is fitted with a Lorentzian line shape (orange); the inset shows an infrared image of the mode-field distribution at 1030 nm. (c) On-chip laser power of the 1030-FP laser versus the input pump power. (d) Output optical spectral signal over a wide sweep of 100 nm of the 1060-FP laser. (e) Spectral amplification near 1062.6 nm; the inset shows an infrared image of the output port of the 1060-FP laser at 1060 nm. (f) Plot of the on-chip output power versus the input pump power of the 1060-FP laser.
Fig. 5. Wavelength tunability with applied voltages through microelectrodes. (a) Normalized laser output at voltages of − 6 V , − 3 V + 3 V + 6 V


Set citation alerts for the article
Please enter your email address

© Copyright 2018-2021 | Chinese Laser Press. All Rights Reserved 沪ICP备15018463号-20