AI Video Guide
  AI Picture Guide
 AI One Sentence
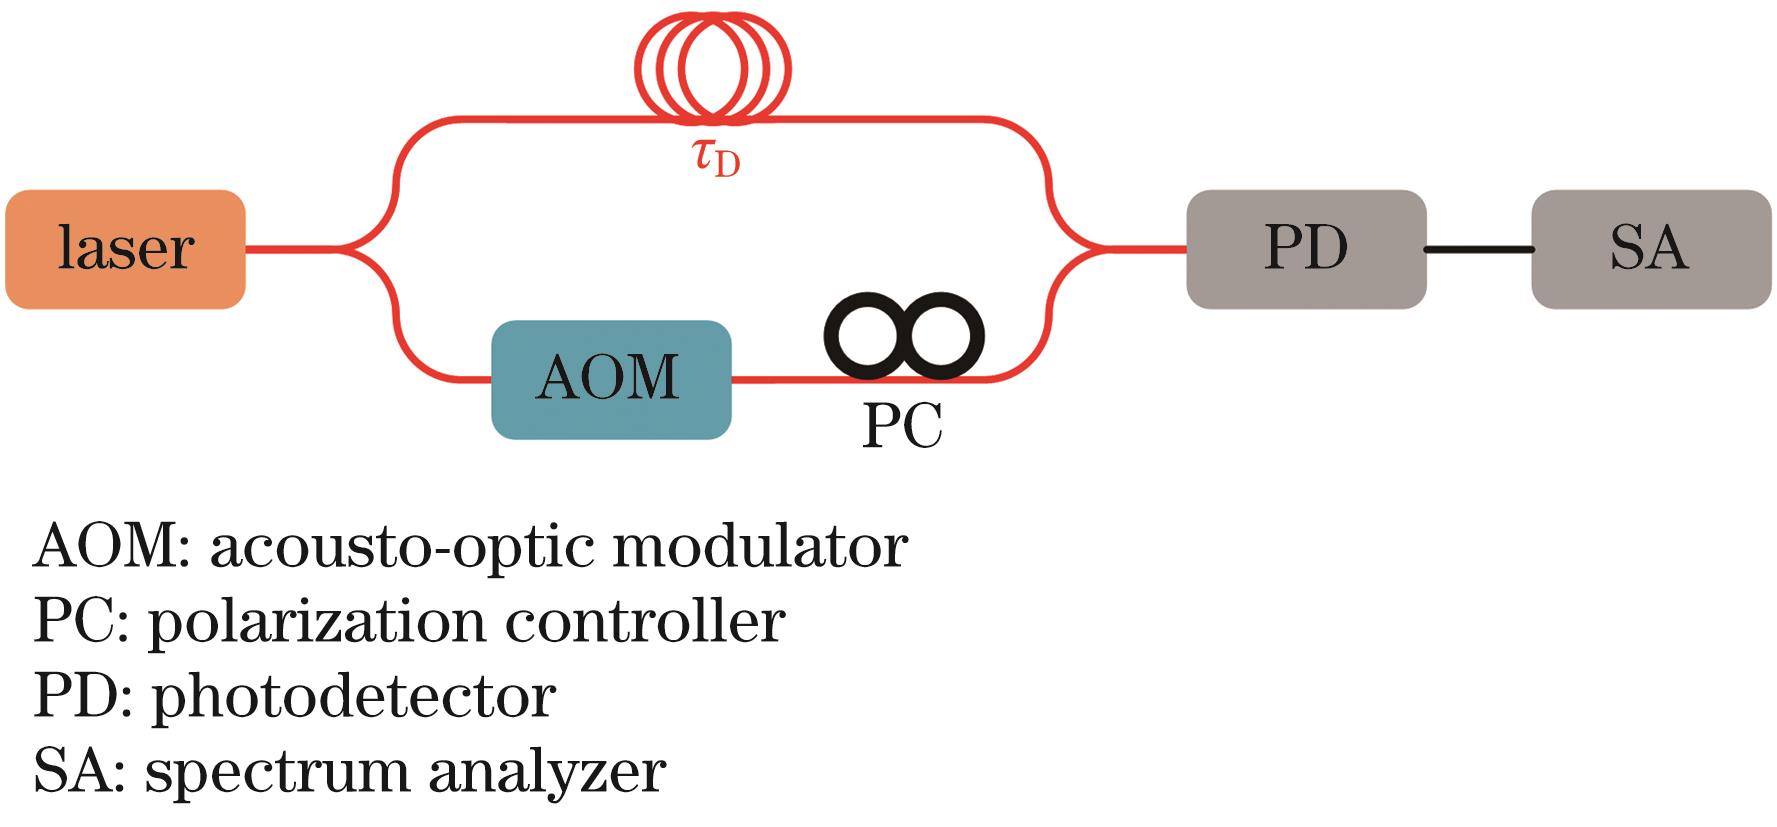
The frequency noise and linewidth of a single-frequency continuous-wave semiconductor laser in a coherent detection system are crucial for evaluating the basic performance of a system. The linewidth can be measured directly using delay self-heterodyne interferometers with short or ultralong optical fibers. These measurements show that only the upper limitation capability of coherent detection systems can be directly evaluated from the linewidth or frequency noise of the laser. However, this method lacks detailed information about the entire system, such as the signal-to-noise ratio (SNR) under different detection conditions. Although the linewidth and frequency noise mentioned above can represent the performance of a coherent detection system to some extent, the frequency noise curve of a laser contains more information, including 1/f noise in the low-frequency area, corner frequency, and white noise. According to the Wiener?Khintchine theorem, the autocorrelation function of a coherent detection system can be calculated from the frequency-noise curve, and the SNR can be obtained using the Fourier transform of the autocorrelation function. However, reconstructing coherent detection spectra from frequency-noise curves is difficult. The unconventional frequency noise curves and large amount of computation make it difficult and time consuming to analyze the evolution of the SNR in coherent detection systems from coherent to incoherent.
In this paper, we propose a new method for calculating the SNR of a coherent detection system from the frequency-noise curve of a laser in a coherent detection system. In this method, logarithmic sampling and a fast Fourier transform are adopted instead of regular sampling with even spacing when the SNR is calculated to quantitatively characterize the evolution of the entire system from coherent to incoherent. By analyzing the autocorrelation function, Eq. (1), we observe that the intensity of the sinc function decreases with frequency, so the main contribution to the integral result comes from the main lobe in the low-frequency domain, while the contribution from the side lobes is minimal. Thus, when calculating the autocorrelation function of the coherent detection system, the sampling interval for the frequency noise curve in the frequency domain is no longer constant but varies logarithmically, with denser sampling in the low-frequency range and sparser sampling in the high-frequency range. In addition, the data of the frequency-noise curve can be directly obtained from experimental measurements without fitting. This improvement makes the calculation of the autocorrelation function of the system quick and accurate, and the coherent detection spectrum can be reconstructed using a fast Fourier transform. We can extract the SNR based on the calculated spectrum, such that the evolution of the coherent detection system can be characterized quantitatively by the SNR values under different detection distances or lasers with different coherent characteristics.
We compare the theoretical values of the autocorrelation function for white noise with those obtained by the proposed method. Figure 3 shows that the results of the analytical solution (dotted line) agree the results (straight line) calculated by the logarithmic sampling method for
In this study, we propose a new method for calculating the SNR evolution of coherent detection systems from coherent to incoherent based on frequency?noise curves. For any arbitrary frequency noise curve of lasers, this method can quickly and accurately reconstruct the spectral information from the coherent detection signal based on logarithmic sampling and fast Fourier transform. In addition, the linewidth and frequency noise of the entire coherent detection system can be obtained using this method, and the SNRs and line shapes versus detection distances can also be obtained from the measured frequency noise curve to reveal the coherence characteristics more directly, dynamically, and comprehensively. Alternatively, the proposed method dynamically characterizes a stable free-running laser and can be applied to frequency-modulated continuous wave (FMCW) optical sources and optical phase-locked loops (OPLL) to characterize dynamic coherences or evaluate the effects of optical phase-locked loops based on their frequency noise curves if they can be measured. By comparing the results of the coherence characteristics of a laser under free-running, modulation, and phase-locked states, we can establish the relationship between the signal-to-noise ratio and the detection distance, which can help us set the optimum driving parameters for the semiconductor laser in the coherent detection system to achieve the best coherent detection performance.