• Chinese Journal of Lasers
  • Vol. 52, Issue 6, 0606005 (2025)
Jiewei Yang, Tianxin Yang*, Zhaoying Wang, Dongfang Jia, and Chunfeng Ge
Author Affiliations
  • Key Laboratory of Optoelectronics Information Technology, Ministry of Education, School of Precision Instrument and Opto-Electronics Engineering, Tianjin University, Tianjin 300072, China
  • show less
    DOI: 10.3788/CJL241193 Cite this Article Set citation alerts
    Jiewei Yang, Tianxin Yang, Zhaoying Wang, Dongfang Jia, Chunfeng Ge. New Method for Calculating Signal‑to‑Noise Ratio Evolution of Coherent Detection System from Coherent to Incoherent Based on Frequency Noise Curves[J]. Chinese Journal of Lasers, 2025, 52(6): 0606005 Copy Citation Text show less
    Experimental setup diagram for self-heterodyne structure with different delay fiber lengths
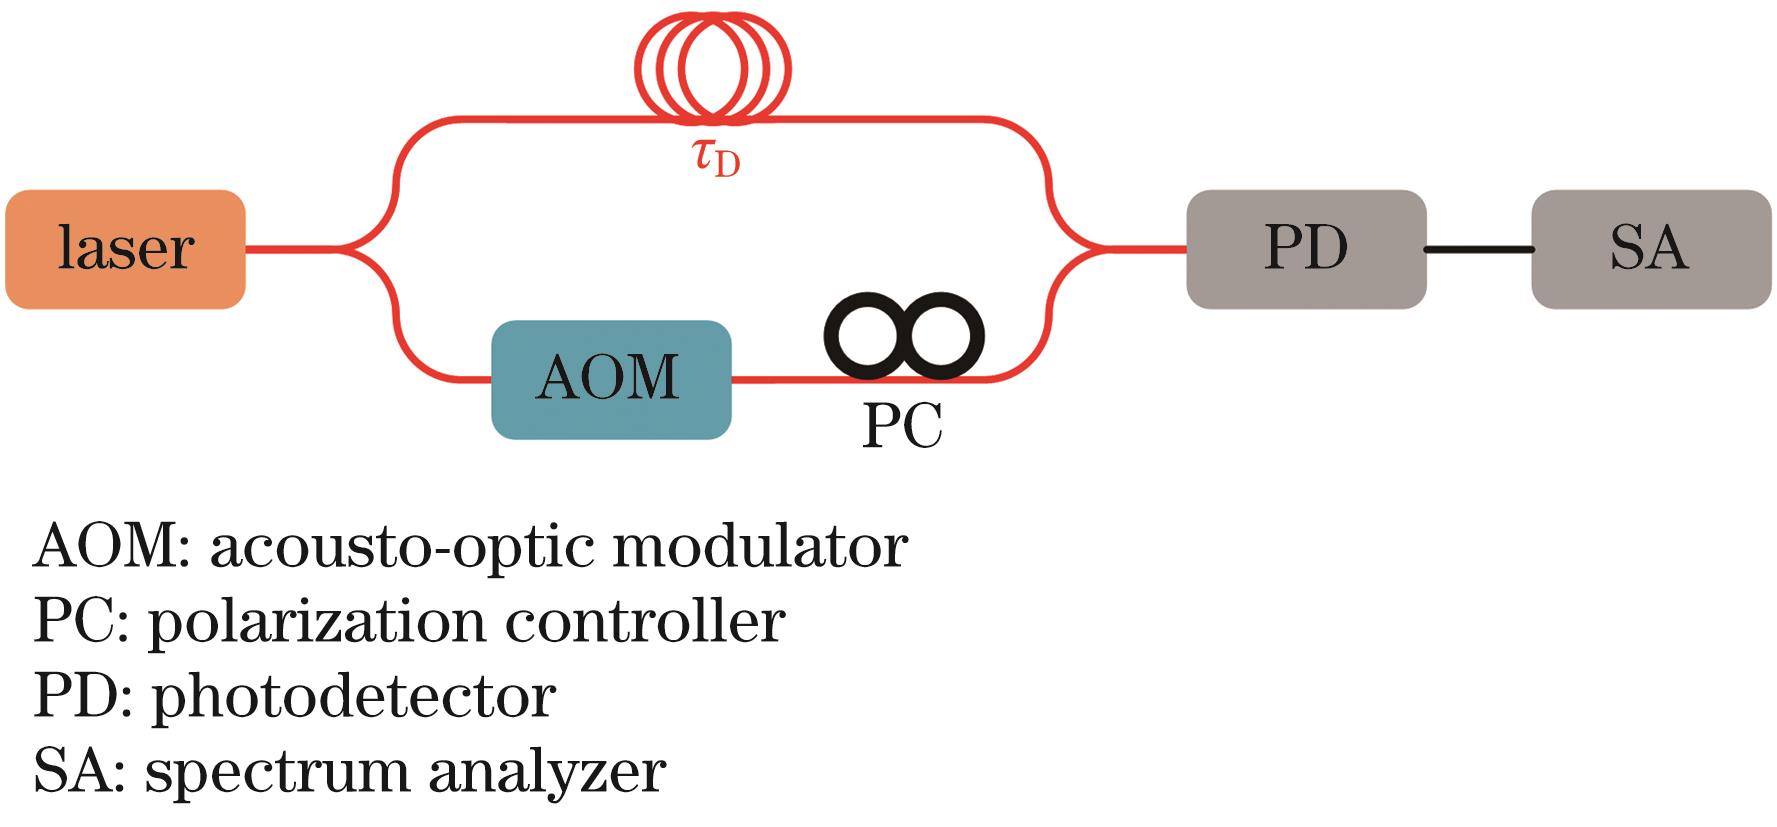
    Fig. 1. Experimental setup diagram for self-heterodyne structure with different delay fiber lengths
    Schematic diagrams of logarithmic sampling algorithm. (a)‒(e) Influence of logarithmic sampling method on integral result under different τ values; (f) curve of exponential part of autocorrelation function under white noise
    Fig. 2. Schematic diagrams of logarithmic sampling algorithm. (a)‒(e) Influence of logarithmic sampling method on integral result under different τ values; (f) curve of exponential part of autocorrelation function under white noise
    Comparison between analytical solution and numerical integration result using logarithmic sampling method
    Fig. 3. Comparison between analytical solution and numerical integration result using logarithmic sampling method
    Self-heterodyne detection results of DFB-LD1 under different time-delay fiber lengths. (a) Frequency noise curve of DFB-LD1; (b) power spectrum curves of beat signals under different fiber lengths; (c) power spectrum curves of beat signal under 50 m time-delay fiber length
    Fig. 4. Self-heterodyne detection results of DFB-LD1 under different time-delay fiber lengths. (a) Frequency noise curve of DFB-LD1; (b) power spectrum curves of beat signals under different fiber lengths; (c) power spectrum curves of beat signal under 50 m time-delay fiber length
    Signal-to-noise ratio of DFB-LD1 versus fiber length in coherent detection system
    Fig. 5. Signal-to-noise ratio of DFB-LD1 versus fiber length in coherent detection system
    Self-heterodyne detection results of DFB-LD2 under different time-delay fiber lengths. (a) Frequency noise curve of DFB-LD2; (b) power spectrum curves of beat signals under different time-delay fiber lengths; (c) power spectrum curves of beat signal under 20 m time-delay fiber length
    Fig. 6. Self-heterodyne detection results of DFB-LD2 under different time-delay fiber lengths. (a) Frequency noise curve of DFB-LD2; (b) power spectrum curves of beat signals under different time-delay fiber lengths; (c) power spectrum curves of beat signal under 20 m time-delay fiber length
    Dynamic change of SNR of beat signal
    Fig. 7. Dynamic change of SNR of beat signal

    Fiber

    length /m

    Experimental SNR /dBCalculated SNR /dB

    Error /

    dB

    2018.65018.7000.050
    505.1305.2100.080
    Table 1. SNR of DFB-LD2 at 35 kHz carrier frequency offset versus fiber length in coherent detection system
    Jiewei Yang, Tianxin Yang, Zhaoying Wang, Dongfang Jia, Chunfeng Ge. New Method for Calculating Signal‑to‑Noise Ratio Evolution of Coherent Detection System from Coherent to Incoherent Based on Frequency Noise Curves[J]. Chinese Journal of Lasers, 2025, 52(6): 0606005
    Download Citation