• Chinese Journal of Lasers
  • Vol. 52, Issue 8, 0802404 (2025)
Xicong Zhu1, Rong Chen2, Xiansong He1, Jin Xie1,*, and Shanshan He1
Author Affiliations
  • 1College of Mechanical and Automotive Engineering, South China University of Technology, Guangzhou 510640, Guangdong , China
  • 2Guangdong University of Science and Technology, Dongguan 523083, Guangdong , China
  • show less
    DOI: 10.3788/CJL241192 Cite this Article Set citation alerts
    Xicong Zhu, Rong Chen, Xiansong He, Jin Xie, Shanshan He. Experimental Study on Picosecond Laser Etching and Flow Properties of Glass Microchannels[J]. Chinese Journal of Lasers, 2025, 52(8): 0802404 Copy Citation Text show less
    Design diagrams of micro-nano topology structure of microfluidic chip. (a) Three-dimensional (3D) model of chip;
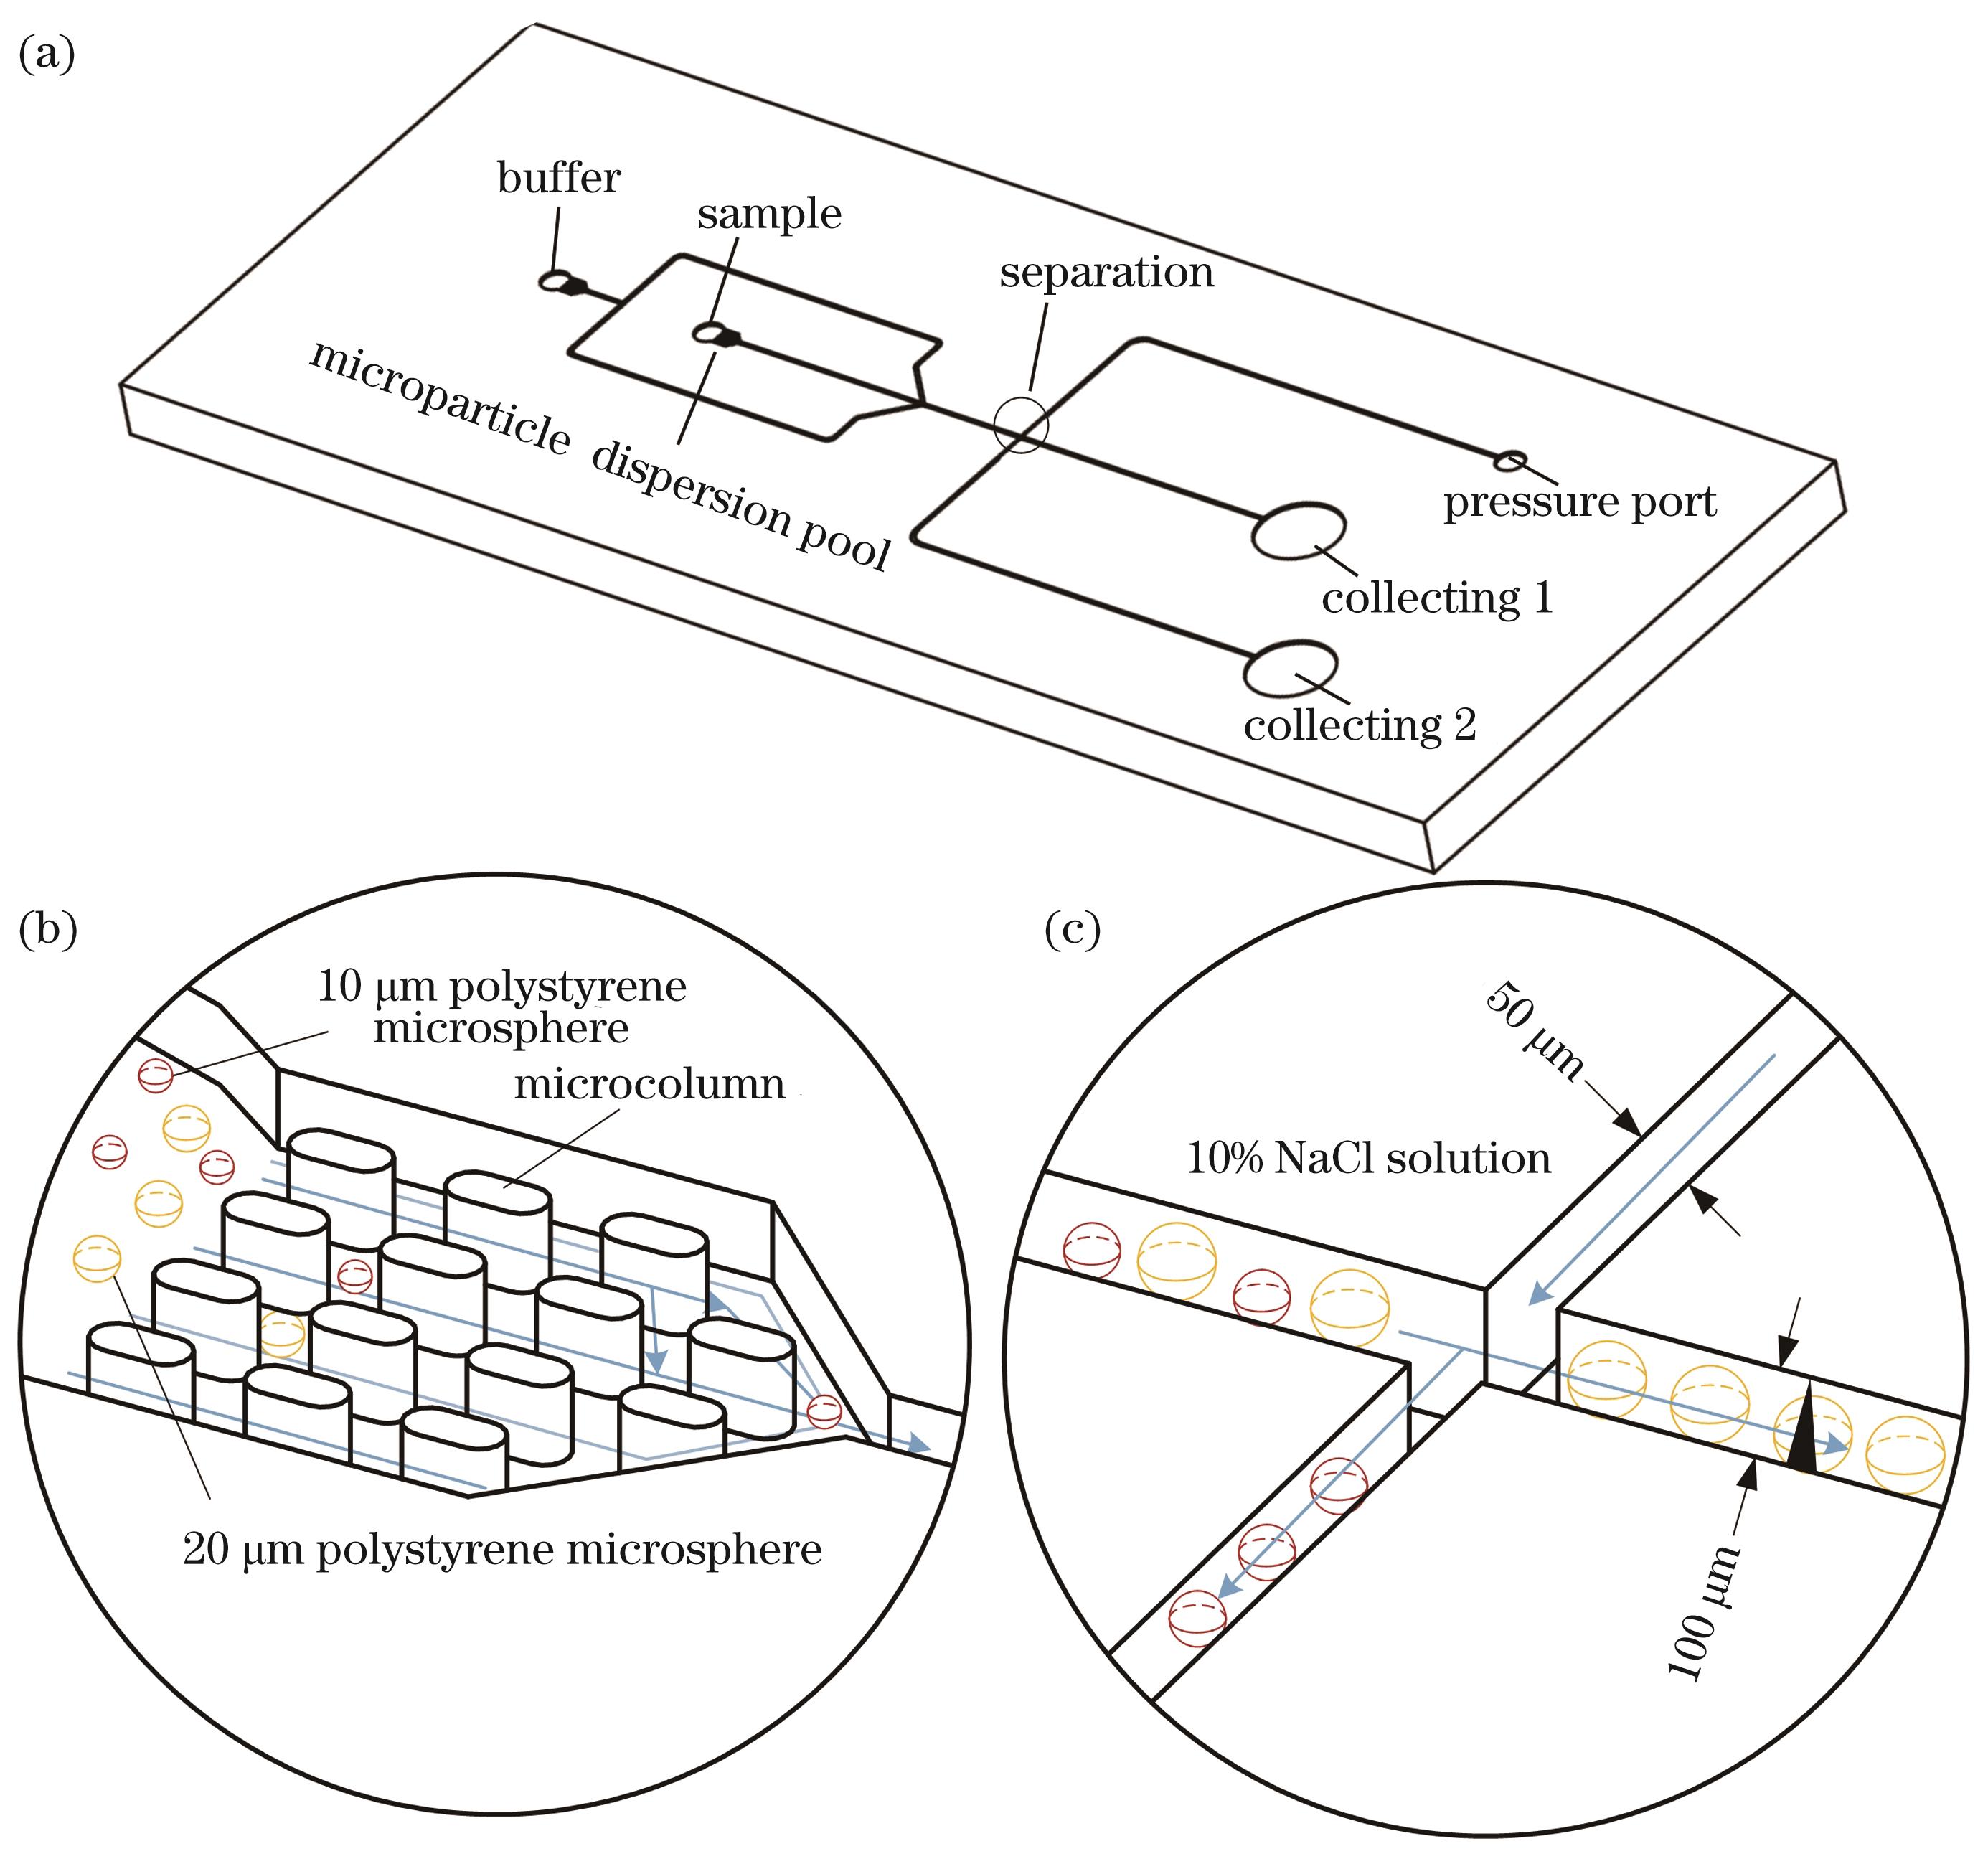
    Fig. 1. Design diagrams of micro-nano topology structure of microfluidic chip. (a) Three-dimensional (3D) model of chip;
    Scene of picosecond green light etching of glass
    Fig. 2. Scene of picosecond green light etching of glass
    Schematic diagram of laser optical path
    Fig. 3. Schematic diagram of laser optical path
    Laser processing channel path and focus position adjustment. (a) Laser processing roadmap; (b) dynamic adjustment of laser focusing position
    Fig. 4. Laser processing channel path and focus position adjustment. (a) Laser processing roadmap; (b) dynamic adjustment of laser focusing position
    Microfluidic chip packaging scene. (a) Plasma treatment of surface-mounted PDMS materials; (b) laser drilling for PDMS packaging
    Fig. 5. Microfluidic chip packaging scene. (a) Plasma treatment of surface-mounted PDMS materials; (b) laser drilling for PDMS packaging
    Physical picture of encapsulated glass microfluidic chip
    Fig. 6. Physical picture of encapsulated glass microfluidic chip
    Flow performance testing platform of microfluidic chip
    Fig. 7. Flow performance testing platform of microfluidic chip
    Relationship between laser power P and microchannel depth h
    Fig. 8. Relationship between laser power P and microchannel depth h
    Scanning speed vl versus microchannel depth h and surface roughness Ra
    Fig. 9. Scanning speed vl versus microchannel depth h and surface roughness Ra
    Cumulative number N versus channel depth h and surface roughness Ra
    Fig. 10. Cumulative number N versus channel depth h and surface roughness Ra
    P, vl, and N versus channel depth h at different levels
    Fig. 11. P, vl, and N versus channel depth h at different levels
    P, vl, and N versus surface roughness Ra at different levels
    Fig. 12. P, vl, and N versus surface roughness Ra at different levels
    3D morphology detection of microfluidic chips. (a) Micropillar array; (b) crossed microfluidic channels; (c) separation port flow channel
    Fig. 13. 3D morphology detection of microfluidic chips. (a) Micropillar array; (b) crossed microfluidic channels; (c) separation port flow channel
    Fluid detection at array inlet
    Fig. 14. Fluid detection at array inlet
    Relationship between microsphere speed vs and time t at array inlet
    Fig. 15. Relationship between microsphere speed vs and time t at array inlet
    Flow experimental photos of 45° cross channel processed under different parameters. (a) vl=1000 mm/s, P=15 W, N=6; (b) vl=200 mm/s, P=9 W, N=6
    Fig. 16. Flow experimental photos of 45° cross channel processed under different parameters. (a) vl=1000 mm/s, P=15 W, N=6; (b) vl=200 mm/s, P=9 W, N=6
    Detection of microfluidic pinched flow. (a) Pinched flow; (b) microsphere acceleration
    Fig. 17. Detection of microfluidic pinched flow. (a) Pinched flow; (b) microsphere acceleration
    Relationship between microsphere displacement x' and time t
    Fig. 18. Relationship between microsphere displacement x' and time t
    Sorting result
    Fig. 19. Sorting result
    Relationship between microsphere speed vsand time t
    Fig. 20. Relationship between microsphere speed vsand time t

    Density /

    (g/cm3

    Elastic

    modulus /GPa

    Linear expansion

    coefficient /℃-1

    Vickers

    hardness /GPa

    Transition

    temperature Tg /℃

    Poisson

    coefficient

    Toughness KIC /

    (MPa·m0.5

    2.5729×10-62.55500.220.75
    Table 1. Material characteristics of silica sodium calcium glass
    Wavelength /nm

    Laser power

    P /W

    Spot diameter

    D /μm

    Repetition frequency

    f /kHz

    Scanning speed vl /

    (mm•s-1

    Pulse

    width /ps

    5320‒1820100‒5000‒45007
    Table 2. Process parameters
    ParameterLevel 1Level 2Level 3Level 4
    Laser power P /W681012
    Scanning speed vl /(mm•s-1800110014001700
    Number of scans N25811
    Table 3. Parameter level selection of laser etching channel process
    Xicong Zhu, Rong Chen, Xiansong He, Jin Xie, Shanshan He. Experimental Study on Picosecond Laser Etching and Flow Properties of Glass Microchannels[J]. Chinese Journal of Lasers, 2025, 52(8): 0802404
    Download Citation