• Advanced Photonics Nexus
  • Vol. 3, Issue 6, 066003 (2024)
Chenxiao Lin, Yifan Wang, and Yidong Tan*
Author Affiliations
  • Tsinghua University, State Key Laboratory of Precision Measurement Technology and Instruments, Department of Precision Instrument, Beijing, China
  • show less
    DOI: 10.1117/1.APN.3.6.066003 Cite this Article Set citation alerts
    Chenxiao Lin, Yifan Wang, Yidong Tan, "High precision and sensitivity anti-interference 3D coherent ranging based on dual reversely chirped self-mixing lasers," Adv. Photon. Nexus 3, 066003 (2024) Copy Citation Text show less

    Abstract

    Frequency-modulated continuous-wave light detection and ranging (FMCW lidar) is a powerful high-precision ranging and three-dimensional (3D) imaging technology with inherent immunity to ambient light and the ability to simultaneously yield distance and velocity information. However, the current withdraws of the traditional FMCW lidar systems are the poor resistance to environmental disturbance and high requirements for echo power, which greatly restrict their applications for high-precision ranging of noncooperative targets in dynamic measurement scenes. Here, we report an all-fiber anti-interference FMCW lidar system with high sensitivity and precision, employing a unique self-mixing stimulation radiation process for signal amplification, a special reversely chirped dual laser structure, and a common-path design for disturbance compensation. We evaluate the ranging accuracy, precision, and stability of the system completely. Finally, we demonstrate an ultralow echo detection limit of subpicowatts with a probe power of below 0.1 mW, a state-of-art localization accuracy of better than 50 μm, high stability with a standard deviation of 6.51 μm over 3 h, and high-quality 3D imaging of noncooperative objects in a fluctuating environment. With the advantages of high precision and stability, weak signal detection capability, and anti-interference ability, the proposed system has potential applications in space exploration, autodriving, and high-precision manufacturing.

    1 Introduction

    Recently, the flourishing development of manufacturing industry, precise metrology, and aerospace has increased the demand for the high-performance ranging and three-dimensional (3D) imaging systems. Due to the noncontact and long-distance measurement ability, light detection and ranging (lidar) stands out among existing methods and has been extensively applied in various areas, such as autonomous driving,1 environmental monitoring,2,3 remote sensing,4 and 3D mapping.5 Compared with conventional mature ranging methods, such as time-of-flight (TOF) lidar and structured light sensors, the frequency-modulated continuous-wave light detection and ranging (FMCW lidar) has inherent immunity to the ambient light and thus a higher ranging stability. Furthermore, FMCW lidar can easily achieve high ranging resolution without high-bandwidth electronic devices and is capable of obtaining the distance and velocity information simultaneously in a single measurement.68 Therefore, it has become a research hot spot in the past few years.

    One of the biggest drawbacks of FMCW lidar is the limited echo detection sensitivity, which restricts its applications in weak light detection and low-reflectivity object metrology. In practical applications, the light power reflected from the targets, which depends on multiple factors, such as surface reflectance and incident angle, is normally weak and uncontrollable. Especially for noncooperative targets, which refer to the scattering objects that have lower surface reflectivity than cooperative targets, such as reflective mirrors, the insufficient echo power cannot provide a desirable signal-to-noise ratio (SNR), resulting in a shorter detection range and lower precision. The most direct way to improve the SNR of the echo signal is to increase probe power, including selecting high-power light sources and employing additional optical amplifiers. Despite the maturity of these devices, the complexity, cost, and power consumption of the system have increased. Multiple optical and electrical methods have also been previously demonstrated to strengthen the SNR of measuring signals, such as phase-locked loop,9,10 special avalanche photodetector,11 distributed feedback (DFB) laser array,1214 hybrid interferometer,15,16 iterative pre-distortion,17 and sideband modulation,18,19 which have improved the SNR and extended the detection range to some extent. However, the existing methods require either additional expensive devices or complicated compensation setups and algorithms, which affects their practicality. What is more, most methods still demand adequate echo power to ensure good precision. The balance among high echo-signal sensitivity, low cost, and simple structure remains a big test.

    Another major challenge faced by FMCW lidar is the anti-interference ability in a fluctuating environment. In many practical ranging scenarios, environmental disturbance, including air turbulence, temperature fluctuations, and other environmental vibrations, is one of the most important and unavoidable factors that affect the precision of 3D coherent ranging. The measuring stability and accuracy are of great significance, while they are difficult to be ensured in a disturbed environment without appropriate compensation. So far, many methods have been proposed for the compensation of vibration in FMCW lidar.2024 But the effectiveness of these methods has only been demonstrated in simulation or single-point ranging situations, lacking further discussions of practical 3D imaging in actual jittering environments. Many effective technologies used to improve the FMCW-based 3D imaging quality have also been reported in the last few years, such as iterative learning control,17 injection locking,25 high-Q microring resonators,26 fiber Bragg grating calibration,27 and frequency combs.28 However, these technologies concentrate more on the sweeping nonlinearity elimination of the light sources while ignoring the impact of environmental disturbances. In practical applications, the Doppler frequency shift caused by the environmental jitter leads to a deviation of the peak position of the signal spectrum, affecting the measurement precision directly. This situation can be improved by averaging the beat frequencies of the adjacent demodulation regions when the surrounding environment fluctuates slowly. However, this method is not strictly real time and is unable to eliminate the vibration effectively in a common environment with changing fluctuations, thereby affecting the high-precision ranging performance and limiting the quality of 3D imaging.

    Here, we demonstrate an ultrahigh precision and sensitivity anti-interference all-fiber FMCW lidar based on a pair of reversely chirped self-mixing lasers. Through establishing a unique self-mixing stimulated radiation process, the proposed system achieves ultrahigh echo detection sensitivity without adding additional expensive devices. With a single-laser output power of less than 0.1 mW, the system reaches an ultralow detection limit of subpicowatts and a high ranging linearity of 1.84×10⁴. A dual self-mixing laser structure with reversely chirped optical frequency is proposed for the real-time vibration compensation, enabling the system to possess a state-of-art localization accuracy of better than 50  μm and high ranging stability of 6.51  μm over 3 h targeting a noncooperative object. Furthermore, a common-path detection layout is designed to enhance the effectiveness of the compensation, and the dynamic ranging stability under different levels of disturbance is tested. Finally, the anti-interference imaging ability is demonstrated through 3D imaging experiments of various objects in a fluctuating environment.

    2 Results

    2.1 Reversely Chirped Self-Mixing FMCW Lidar System

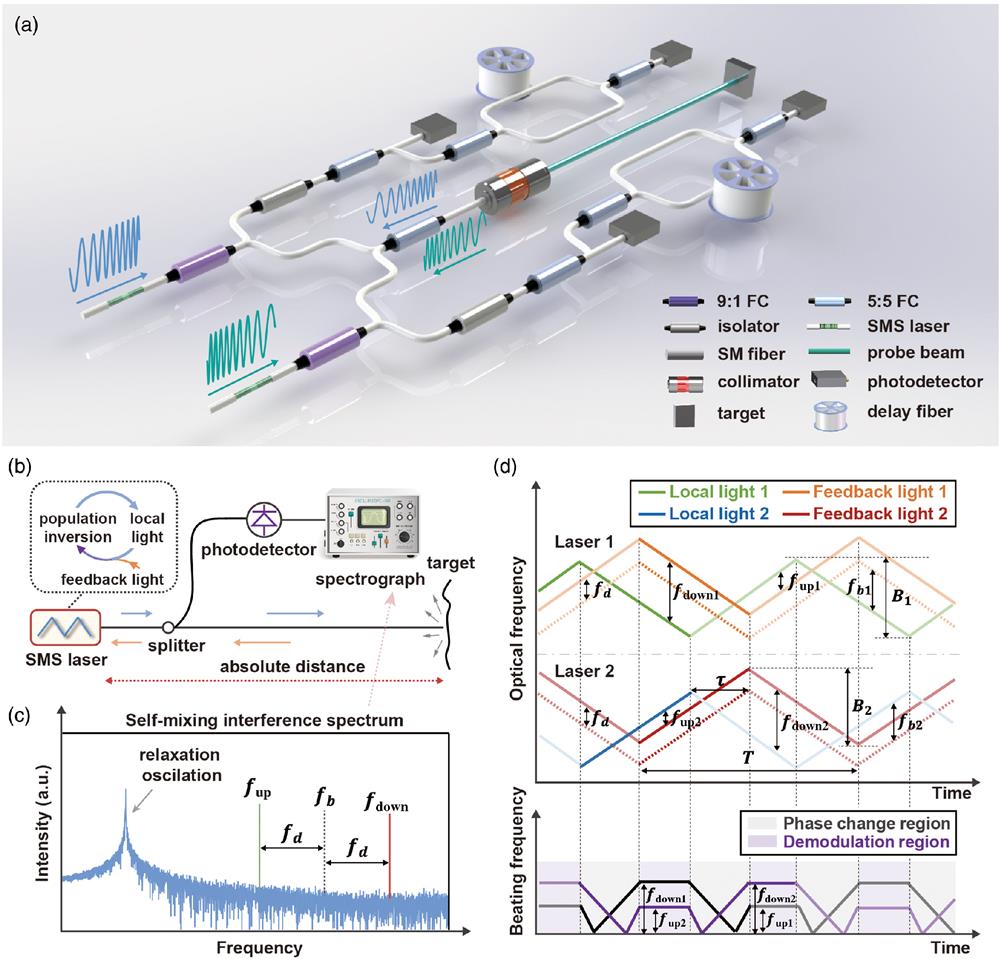
    As shown in Fig. 1(a), the proposed reversely chirped self-mixing FMCW lidar system employs a dual self-mixing swept (SMS) laser structure for signal amplification and vibration compensation, two separated auxiliary unbalanced Mach–Zehnder interferometers (MZIs) for swept nonlinearity suppression, and a common-path detection part for signal transmission and reception. The SMS lasers simultaneously emit continuous lights in the C-band with opposite sweeping directions, which are then divided into two parts using a 9:1 fiber coupler (FC). Both beams are recombined into a single-mode (SM) fiber with a 5:5 FC and illustrated onto the target through a collimator. The small portion passes through an optical isolator and is further divided into two parts: with one part being received by a photodetector for distance demodulation and the other part entering an MZI for swept nonlinearity monitoring. A resampling-based method29,30 using the clock interference signal generated from the auxiliary MZI is employed to eliminate the laser tuning fluctuations that may result in spectrum broadening and precision deterioration. Compared with the various existing swept nonlinearity methods, such as optical phase-locked loop,9,31 injection locking,18,25 phase-noise-compensated technique,32,33 and the optical comb,34,35 this method has the merits of high robustness, low cost, and simple data processing, thus possessing a good practicality in real-time changing environments. The detailed experimental process and formula derivation are described in Secs. 4 and 5, respectively.

    System configuration and working principle of the reversely chirped self-mixing FMCW lidar system. (a) Architecture of the proposed reversely chirped self-mixing FMCW lidar. FC, fiber coupler; SM, single mode; SMS, self-mixing swept. (b) Basic system configuration of self-mixing FMCW lidar. (c) Spectrum of self-mixing FMCW signal under vibrating environment. (d) Schematic diagram of working principle of real-time vibration compensation.

    Figure 1.System configuration and working principle of the reversely chirped self-mixing FMCW lidar system. (a) Architecture of the proposed reversely chirped self-mixing FMCW lidar. FC, fiber coupler; SM, single mode; SMS, self-mixing swept. (b) Basic system configuration of self-mixing FMCW lidar. (c) Spectrum of self-mixing FMCW signal under vibrating environment. (d) Schematic diagram of working principle of real-time vibration compensation.

    In contrast to conventional FMCW lidar with an MZI structure, additional FCs and circulators (CIRs) are no longer needed to create a reference signal in the detection part of the self-mixing FMCW lidar, as shown in Fig. 1(b). Instead, the local intracavity light functions as a reference. Through reinjecting the reflected light into the laser cavity, a beating signal carrying time-delay information of the probe beam is produced. Meanwhile, the weak feedback light participates in the simulated radiation of the laser, and the original population inversion is broken and rebuilt.3639 This special mechanism further amplifies the interference signal, which has been widely demonstrated in multiple fields, including velocity measurement,40,41 biochemical testing,42,43 and angular sensing.44 This gain can reach the order of 106 for microchip lasers and 105 for fiber lasers.37,39 The change of the laser states influences the output light intensity, which can be modeled using the following equation:45ΔI(t)/Is=κG(ατ)·cos(2πατt+2πf0τατ2/2+ϕs),where Is is the output power of the laser without feedback light, κ is the feedback strength coefficient of the interfering light, which is proportional to the effective reflectivity of the target, α is the tuning rate, τ represents the probe beam time delay that is related to the target distance, G stands for the gain function that is associated with α and τ, and ϕs is the fixed initial phase. It is worth noting that, in our system, the dual reversely chirped feedback lights entering the laser cavity come from two independent lasers, and the self-mixing stimulation radiation process is only effective for homologous feedback light due to the coherent interference detection.3639 In contrast, the light components originating from a different light source rapidly decay because they do not meet the cavity resonance conditions, which hardly affects the measurement quality.

    Through separating the output light with a splitter, one branch of the interference signal is recorded by a photodetector, and its spectrum can be further analyzed on a spectrograph as shown in Fig. 1(c), in which the Doppler frequency shift fd brought by the environmental vibration causes the up-swept and down-swept beat frequency to deviate from the spectral peak position fb under static measurement conditions. To solve this problem, a dual reversely chirped laser structure is designed; the schematic diagram of the working principle is displayed in Fig. 1(d). Assuming the output light from each laser is swept with a standard triangular wave, the beat frequency remains constant during a demodulation region. The time-varying Doppler frequency shift results in differences in the beat frequency of adjacent demodulation region of a single laser, which makes it difficult to effectively eliminate the jitter. Note that the Doppler frequency shift is approximately equal for the two lasers, considering that their central wavelengths are very close. The beat frequency of the up-swept and down-swept region can be modeled as fup(t)=2Bτ/Tfd(t),fdown(t)=2BτT+fd(t),where B and T denote the bandwidth and period of the frequency modulation, respectively. By emitting reversely chirped swept light through two lasers, the real-time compensation can be achieved by averaging the beat frequency in the same demodulation region of the two lasers. The detailed equation is presented in Sec. 5. Furthermore, the common-path detection design shown in Fig. 1(a) greatly ensures the consistency of disturbances between two detection signals, further improving the validity of the compensation.

    2.2 SMS Laser Design and Evaluation

    The schematic structure of an SMS laser used in the proposed system is shown in Fig. 2(a). A compact erbium-doped DFB fiber laser fixed on a piezoelectric ceramic actuator (PZT) is employed as the light source and is backward pumped by a single-frequency semiconductor laser, which is centered at 980 nm and driven by a temperature-controlled laser driver, using a wavelength division multiplexer (WDM). The forward output of the laser enters the subsequent fiber system through the WDM, while the backward light is used for monitoring. An optical isolator is installed in the monitoring part to prevent the unwanted reflected light from affecting the self-mixing process. Frequency modulation is completed by periodically stretching the laser cavity using a PZT. A photo of the experimental setup is shown in Fig. 2(b). Owing to the large mode-hopping-free swept range and the modulation method, the stability of the self-mixing interference is guaranteed. The reversely chirped output of the SMS laser is achieved by applying reverse triangular voltage to PZT, as shown in Fig. 2(c), and a 105 GHz mode-hopping-free tuning is achieved when the amplitude of the driving voltage is set to 90 V. To minimize the impact of the unideal transmission in the phase-change region, 95% of each ramp is selected as the region of interest (ROI) for signal demodulation. With the C-band output wavelength and the submilliwatt output level, safety and low power consumption are both ensured.

    Design and testing of SMS lasers. (a) Schematic diagram of the SMS laser. (b) Photograph of the experimental setup of the SMS laser. ISO, isolator; WDM, wavelength division multiplexer; PZT, piezoelectric ceramic actuator. (c) Driving voltages and the corresponding frequency deviation. ROI, region of interest. (d) Power spectrum of the SMS laser obtained through delay self-heterodyne interferometry method. (e) Spectrum, FWHM, and (f) repeated resolution testing results of the long-distance ranging.

    Figure 2.Design and testing of SMS lasers. (a) Schematic diagram of the SMS laser. (b) Photograph of the experimental setup of the SMS laser. ISO, isolator; WDM, wavelength division multiplexer; PZT, piezoelectric ceramic actuator. (c) Driving voltages and the corresponding frequency deviation. ROI, region of interest. (d) Power spectrum of the SMS laser obtained through delay self-heterodyne interferometry method. (e) Spectrum, FWHM, and (f) repeated resolution testing results of the long-distance ranging.

    The measuring range is of great importance for an FMCW lidar system, which, theoretically, is determined by the coherence length of the light source. Compared to most commercial semiconductor DFB lasers and vertical-cavity surface-emitting lasers (VCSELs), fiber lasers normally possess a narrower linewidth and therefore a longer coherent length while maintaining a good swept range. A delay self-heterodyne interferometry method46,47 with a 6 MHz acousto-optic modulator and a 30 km long delay fiber is employed to evaluate the linewidth of the laser to estimate the coherent length; the result is shown in Fig. 2(d). Since the 3  dB bandwidth of the power spectrum is often larger than the true value due to the noise influence near the center frequency,46 the 20  dB bandwidth that is equal to 299 times of the linewidth is taken for estimation. The linewidth of both lasers is calculated to be <42  kHz, corresponding to a coherent length of greater than 7 km. Furthermore, the ranging resolution over a long optical distance targeting an unpolished steel plate is evaluated by the full width at half-maximum (FWHM), as shown in Fig. 2(e). The resolution results of 20 repeated tests displayed in Fig. 2(f) show that the system possesses a ranging resolution of <1.8  mm, which is determined by the effective swept bandwidth13 and is slightly worse than the theoretical values.

    2.3 Localization Accuracy and Linearity

    To demonstrate the high localization accuracy achieved by our reversely chirped self-mixing FMCW lidar, repeated step positioning experiments are conducted targeting an unpolished steel target mounted on a high-precision displacement stage with 50 nm localization accuracy. Here, the localization accuracy refers to how close the measurement result is to the ground truth. The displacement stage, as well as the target, moved 500  μm with a step interval of 50  μm, and the measurements are repeated 20 times at each position. The relative distance results around the initial step position using different demodulation methods, including the widely used single up/down ramp demodulation method, the adjacent-averaging demodulation method with a single laser, and the proposed method, are shown in Fig. 3(a), along with the experimental setup diagram in the bottom right of the figure. The detailed comparison among the above demodulation methods is further discussed in Sec. 4. It is seen that big fluctuations exist in the experimental data using single-laser methods, resulting in great differences between the measuring results and ground truths. In contrast, the 50  μm step motion of the noncooperative target can be stably and accurately indicated utilizing the proposed method, which is state-of-art among the existing FMCW lidar systems, to the best of our knowledge. In addition, the standard deviation (SD) and range of the measurement results at each position are calculated to evaluate the ranging repeatability, as shown in Fig. 3(b). Although the deviations of the results are significant when employing the single-laser methods, the SD and range of the ranging results maintain a low level of <5 and 20  μm throughout the entire stepping process using the proposed approach, respectively. What is more, the ranging linearity, which is defined as the ratio of the absolute residual error to the range, is tested to demonstrate the nonlinear error of the system. The experimental setup is the same as the localization accuracy test, except for the motion setting with a step interval of 1 cm and a total of 10 cm, which is the maximum moving range of the stage. The averaged results of 20 measurements, linear fitting, and residual errors are displayed in Fig. 3(c). With a maximum residual error of 18.32  μm, the system has a good ranging linearity of 1.83×10⁴ during the 10 cm range, verifying a low level of nonlinear error.

    Results of system localization accuracy and linearity. (a) Localization accuracy results under different methods with 50 μm step motion. Inset: diagram of experimental setup. (b) SD and range of 20 measurements at each position in localization accuracy experiment. (c) Results of linearity test with 10 cm ranging, including average ranging results, linear fitting results, residual error, and part of original data.

    Figure 3.Results of system localization accuracy and linearity. (a) Localization accuracy results under different methods with 50  μm step motion. Inset: diagram of experimental setup. (b) SD and range of 20 measurements at each position in localization accuracy experiment. (c) Results of linearity test with 10 cm ranging, including average ranging results, linear fitting results, residual error, and part of original data.

    2.4 Long-Time Ranging Stability

    To characterize the ranging stability of the system under a relatively stable environment, long-time repeated same-spot measurement is conducted targeting the same steel plate as the linearity testing. The measurement deviations from the average employing different demodulation methods are depicted in Fig. 4(a). During a long-term test of over 3 h, the system has an SD of 6.51  μm, which is the lowest compared with other methods. The results also show that the overall drift of the single-laser-based methods is relatively stable due to the stability of the environment and the high sensitivity of the system. It is noted that the adjacent-averaging method achieves a low level of SD comparable to the proposed method due to the slow variation of environmental jitter over time. Data distribution statistics are also performed to reflect the degree of results concentration, as shown in Fig. 4(b). It is seen that the discreteness of the results has been significantly improved through the proposed dual-laser framework, and the deviation of most results is below 20  μm, proving the high stability of the system.

    Results of long-time ranging stability. (a) Ranging results of over 3 h. Inset: SD of ranging results. (b) Data distribution and corresponding Lorentz fittings of long-time ranging results using different methods.

    Figure 4.Results of long-time ranging stability. (a) Ranging results of over 3 h. Inset: SD of ranging results. (b) Data distribution and corresponding Lorentz fittings of long-time ranging results using different methods.

    2.5 Detection Limit

    As illustrated in Eq. (1), compared to the classical optical beating, an extra amplification G exists due to the self-mixing in the laser cavity. To experimentally evaluate the detection limit of the system, a corner cube mirror is used as the target. A loop structure with an adjustable fiber attenuator and two CIRs is used in the experiment, as displayed in Fig. 5(b), and the experimental results and corresponding linear fitting results are shown in Fig. 5(a). It is observed that the SNR shows a linear decrease as the attenuation of the tunable attenuator increases. Owing to the self-mixing gain, the SNR still exceeds 6.5 dB even at a total feedback attenuation of 66.68  dB, including the attenuation of the adjustable attenuator and an insertion loss of about 1 dB, as shown in the inset in Fig. 5(a). Furthermore, the total attenuation at the detection limit, where SNR equals 0 dB, is determined through linear fitting to be 80.72  dB for laser 1 and 81.99  dB for laser 2. Given that the output power of each laser is 65  μW, the minimum echo detection power is calculated to be 0.69 and 0.52 pW, respectively, confirming the ultrahigh sensitivity of the proposed system. These calculations are detailed in Sec. 5. It is noted that the discrepancy in the detection limit between the two lasers mainly comes from their different polarization states and relaxation oscillation frequencies,3639 which is closer to the beat frequency for laser 2, as shown in Fig. 5(c).

    Detection limit of the system. (a) The SNR versus feedback attenuation targeting a corner cube mirror. Inset: the spectrum of the self-mixing signals at maximum optical attenuation that can be provided in the experiment. (b) Diagram of the experimental setup for detection path with arrows indicating the transmitting direction of the light. CIR, circulator; COL, collimator; CM, corner cube mirror. (c) Spectrum of the laser relaxation oscillation.

    Figure 5.Detection limit of the system. (a) The SNR versus feedback attenuation targeting a corner cube mirror. Inset: the spectrum of the self-mixing signals at maximum optical attenuation that can be provided in the experiment. (b) Diagram of the experimental setup for detection path with arrows indicating the transmitting direction of the light. CIR, circulator; COL, collimator; CM, corner cube mirror. (c) Spectrum of the laser relaxation oscillation.

    2.6 Anti-Interference Single-Point Ranging

    To demonstrate the anti-interference ranging stability of the system, repeated same single-point measurements targeting a diffusely scattering unpolished steel plate under vibrating environments are conducted. The experimental ranging results under different kinds of environmental disturbances, which are created through a fan and an air heater, are displayed in Figs. 6(a) and 6(b), respectively. The corresponding SD is also calculated to characterize the ranging stability more intuitively, as shown in Fig. 6(c). It can be clearly seen that the measurement results using the proposed method under both kinds of disturbances have the smallest fluctuation range among all methods. Especially in the jitter environment created by the air heater, where the temperature and air fluctuations coexist, the SD is improved by more than 1 order of magnitude using the proposed method compared with others, demonstrating the anti-interference ranging ability of the system.

    Single-point anti-interference measurement results. Repeated single-point measurement results using different methods with (a) wind interference and (b) wind and heat interference. (c) SD results of various demodulation methods under different interferences.

    Figure 6.Single-point anti-interference measurement results. Repeated single-point measurement results using different methods with (a) wind interference and (b) wind and heat interference. (c) SD results of various demodulation methods under different interferences.

    2.7 Anti-Interference 3D Ranging

    To demonstrate the anti-interference and high-sensitivity imaging capability of the system, multiple noncooperative objects with fine structures and relatively weak surface reflections are selected as targets; the initial optical distance Z0 is around 26 m. The schematic of the experimental setup is shown in Fig. 7(a). Similar to the anti-interference single-point experiments, a fan is employed to generate jitter in the imaging experiments, and a biaxial galvo scanner is used for beam scanning. The data-acquisition flowchart is shown in Fig. 7(b), which is discussed in detail in Sec. 4. First, an ancient copper coin with a rough surface is imaged using the proposed method in a relatively stable environment as a reference, and the result is presented in Fig. 7(c)-ii, which shows a good reconstruction of the target owing to the high sensitivity of the system. Then, the same object is imaged in a jittering environment, and the results using classical single-region/adjacent-averaging demodulation methods with a single laser and the proposed method are shown in Figs. 7(c-iii)7(cv), respectively. Due to the vibration of the environment, the accuracy of 3D imaging results using conventional single-laser demodulation methods is greatly reduced. In contrast, the imaging results using the proposed method still reflect the contour of each character on the coin well. A similar conclusion can be obtained when targeting at three aluminum blocks fixed on a steel plate with shapes of “THU” letters and thicknesses of 3, 2, and 1 mm. It is clearly observed from the imaging results of the traditional methods, presented in Figs. 7(d-iii) and 7(d-iv), that the contour gradually blurs and even blends with the background as the thickness of the aluminum block decreases. Instead, the imaging results using the proposed method, as shown in Fig. 7(d-v), can still accurately reconstruct the results of the object’s contour presented in Fig. 7(d-ii) under a stable environment, proving the effectiveness of the anti-interference ability of the system. Moreover, to further characterize the anti-interference imaging precision of the system, a precisely manufactured aluminum step, which has five surfaces with a thickness difference of 500  μm between each other [shown in Fig. 7(e)] is employed as a target. The imaging results from multiple perspectives under different methods show that the proposed method has the lowest data fluctuations in each surface, and the small differences in thickness between the adjacent surface of the step can still be reconstructed with good fidelity in the time-varying jitter environment using our method. It should be noted that, compared with the traditional single-region demodulation method, the adjacent-averaging method can improve the imaging quality to a certain extent. However, this method shows limited effectiveness when the environment vibrates quickly because the compensation is not strictly real time, which can be addressed using the proposed method.

    Anti-interference 3D imaging results. (a) Schematic of experimental configuration. (b) Data acquisition flowchart. AWG, arbitrary waveform generator; PA, power amplifier; PS, phase shifter; GS, galvo scanners; PC, personal computer; DAQ, data acquisition card; PD, photodetector. The imaging results of (c) an ancient copper coin and (d) three aluminum blocks with different thicknesses. The letters after “-” (from “i” to “v”) correspond to the object photos, static imaging results using the proposed method, imaging results using the traditional single-region method, the adjacent-averaging method, and proposed method. (e) Precisely manufactured aluminum step that has five front surfaces with a difference in thickness of 500 μm between each other. Corresponding imaging results from different perspectives using (f) conventional single-region, (g) adjacent-averaging demodulation method, and (h) proposed method.

    Figure 7.Anti-interference 3D imaging results. (a) Schematic of experimental configuration. (b) Data acquisition flowchart. AWG, arbitrary waveform generator; PA, power amplifier; PS, phase shifter; GS, galvo scanners; PC, personal computer; DAQ, data acquisition card; PD, photodetector. The imaging results of (c) an ancient copper coin and (d) three aluminum blocks with different thicknesses. The letters after “-” (from “i” to “v”) correspond to the object photos, static imaging results using the proposed method, imaging results using the traditional single-region method, the adjacent-averaging method, and proposed method. (e) Precisely manufactured aluminum step that has five front surfaces with a difference in thickness of 500  μm between each other. Corresponding imaging results from different perspectives using (f) conventional single-region, (g) adjacent-averaging demodulation method, and (h) proposed method.

    Moreover, a comparison of the key indicators between our scheme and other previously reported FMCW ranging systems is performed, as presented in Table 1. It can be clearly observed that, owing to the high-ranging sensitivity brought by the self-mixing process, the proposed system achieves the highest ranging precision, exhibits the best linearity, and operates with the lowest probe power compared to other methods, showcasing its superior performance. For the current system, the limitation in ranging resolution stems from the limited sweep bandwidth of the SMS lasers. This could potentially be improved in the future by employing a more powerful PZT to extend the fiber laser, thereby increasing the stretching length.

    MethodProbe powerPrecisionResolutionLinearityTarget
    Ref. 1715 mW250  μm0.99 mmDesk
    Ref. 2510 mW5 cm2.5 cmFoam board
    Ref. 4820 mWMannequin
    Ref. 490.16 mW1 mm5.23 mm2.75×104Hallway
    Ref. 502 cm2.5 cm1.53×102Metal blocks
    This work65  μW50  μm1.8 mm1.83×104Scattering objects

    Table 1. Comparison of the existing FMCW lidar systems.

    3 Discussion

    In summary, a high-precision anti-interference FMCW lidar system based on dual reversely chirped self-mixing lasers with narrow linewidths is demonstrated. Owing to the spontaneous amplification brought by the self-mixing process, the system achieves an ultralow echo detection limit of subpicowatt level, enabling the high-precision ranging of noncooperative targets with low reflectivity at a low output power level of <0.1  mW. Although the swept bandwidth is limited, an ultrahigh localization accuracy of 50  μm targeting a noncooperative steel plate is achieved in repeated tests, which is state of the art among the existing FMCW lidar systems, to the best of our knowledge. Moreover, the real-time compensation for the environmental disturbances is achieved using the dual reversely chirped self-mixing lasers and a common-path detection design, enhancing the measuring precision and stability of the system. A low SD of 6.51  μm is achieved with low power consumption in the repeated single-point ranging experiments targeting at a diffusely scattering steel plate over 3 h, proving the high stability of the system. In addition, the single-point ranging and 3D imaging experiments targeting multiple noncooperative objects under different levels of environmental jitter are performed. Compared to other conventional single-laser methods, the proposed system achieves the lowest-ranging SD and the best imaging quality. Finally, a precisely fabricated step, which has five surfaces with a thickness difference of 500  μm between each other, is reconstructed with good fidelity using the proposed method even with wind fluctuation, further demonstrating the high-precision ranging ability and anti-interference capability of the system.

    Compared with the conventional TOF lidar and amplitude-modulated continuous-wave (AMCW) lidar, which offer the best localization accuracy of centimeter or millimeter-scale,51 the proposed FMCW lidar system can achieve better localization accuracy by 2 orders of magnitude without using additional expensive devices, such as single-photon avalanche diodes. What is more, the TOF lidar and AMCW lidar are susceptible to ambient light such as sunlight and light from another lidar, which reduces the SNR and may result in false detection, while the proposed FMCW lidar has inherent immunity to the ambient light due to its coherent detection, offering a higher ranging stability and precision. In addition, compared with the proposed FMCW lidar, widely used structured light-based 3D imaging methods struggle with ranging inclined objects and balancing detection range and depth resolution.

    In contrast with the conventional FMCW lidar that typically employs an MZI structure, the proposed self-mixing FMCW lidar does not require an additional reference arm in the detection path to produce the beat signal, which eliminates the need for extra fiber devices, such as FCs and CIRs, saving the related costs. Furthermore, in classical FMCW lidar systems, high sensitivity is only achievable when the echo signal power is sufficient, which often requires a light source with high output power or additional optical amplifiers. High-performance lasers and erbium-doped fiber amplifiers (EDFA) increase the cost and complexity, while cheaper semiconductor optical amplifiers (SOAs) commonly suffer from spectral distortion and high nonlinearities. Instead, a spontaneous gain can be obtained through the self-mixing process in our FMCW lidar system, significantly enhancing the sensitivity of the system and enabling high ranging precision and imaging quality with low power consumption when targeting the noncooperative objects with ultralow echo power. Consequently, the proposed scheme eliminates the need for high-power tunable lasers or additional optical amplifiers, and it also reduces the requirements for high-performance photodetectors due to the increased ranging sensitivity from the self-mixing process, greatly reducing overall system costs.

    Although various vibration compensation methods have been proposed in recent years, including additional frequency-shift interferometers,15 signal mixing,20 segmented interference,21 and Kalman filters,52,53 they either require complex structures or suffer from poor real-time compensation effects. What is more important, most existing methods are only discussed in single-point ranging and simulation, and their effectiveness has not been proven in more practical 3D imaging scenarios. The anti-interference capabilities of both single-point ranging and 3D imaging with different demodulation methods are thoroughly discussed in this paper. In a fast-jittering environment where the ranging SD using conventional demodulation methods exceeding 600  μm, the proposed system still maintains a low SD level of below 40  μm. The imaging quality of multiple fine-structured objects is also verified to be greatly improved using the proposed framework.

    Despite the above advantages, there are still many aspects that can be improved in our system in the future. First, the distance resolution of the system, which refers to the ability to distinguish between two simultaneously presented targets, only reaches a millimeter level due to the limited swept bandwidth. In our system, the available effective bandwidth depends on the maximum variation of the laser cavity length, which is determined by the driving force capability of PZT. By selecting a more powerful PZT or other devices with an adjustable cavity, such as a Fabry–Perot filter, the swept bandwidth can be effectively increased. Moreover, the actual self-mixing gain is associated with the frequency of the beating signal, and the maximum gain is achieved when the beating frequency equals the relaxation oscillation frequency, leading to an imbalance in system sensitivity. The SNR and sensitivity of the system can be further improved through appropriate control of the self-mixing gain, such as by adding frequency-shifted devices.44,45 It is noted that the fiber dispersion is neglected in our system due to the relatively small swept bandwidth, which also affects the SNR and can be further improved through the chirp decomposition method.54 In addition, due to the self-mixing based amplification process, the theoretical maximum measuring rate of the system is capped below the relaxation oscillation frequency, which restricts the upper limit of the measuring speed of the system to some extent. Furthermore, there is still a relatively short noncommon-path part in our system, resulting from the coupling process of two lasers. The compensation effect of the Doppler frequency shift can be further enhanced by reducing the length of the noncommon path, implementing more temperature control and fixation, and employing lasers with closer wavelengths.

    In general, with the advantages of high sensitivity, excellent localization accuracy, high ranging stability, and anti-interference ability, the system provides a good solution for 3D coherent imaging, promising potential applications in high-precision assembly, space exploration, and manufacturing detection.

    4 Method

    4.1 Swept Nonlinearity Suppression Based on Resampling

    As shown in Fig. 1(a), in addition to the common-path detection part, two unbalanced MZIs are used for the swept nonlinearity suppression in the auxiliary paths. Because the light is transmitted in optical fiber and carries only a single piece of delay information, the interference signal generated in the auxiliary path normally presents a good sinusoidal shape. The specific resampling process can be described as follows: (1) simultaneously obtain the measuring signal and auxiliary signal with a data acquisition card, and apply digital high-pass filtering on the auxiliary signal to eliminate its baseline. (2) Divide the auxiliary signal into several equal-phase intervals with zero crossing points. (3) Identify the points with the largest absolute value in each interval from step 2 to determine the peak and valley feature points, and record their corresponding positions to form a clock sequence. (4) Resample the measuring signal in the time domain using the clock sequence obtained in step 3. This converts the original equal-time sampling into equal-frequency sampling, effectively eliminating the swept nonlinearity. Note that isolators installed at the front of the auxiliary path are necessary to prevent the optical feedback unwanted beams from participating in the self-mixing process, which may affect the recognition of a beating signal.

    4.2 Comparison between Different Demodulation Methods

    In this paper, many ranging and 3D imaging comparative experimental results between conventional single-laser methods and the proposed method are presented. The single-region demodulation method with a single laser, which uses the beat signal of a fixed up/down swept region for Fourier transform, is normally used in most research due to its simplicity. However, the drift of the peak position of the spectrum caused by the Doppler shift, brought by unavoidable environmental disturbance, cannot be handled well using this method. It is observed that the Doppler frequency shift has opposite effects on the beat frequency of the adjacent demodulation region, as shown in Fig. 1(d), assuming the environmental jitter remains unchanged during a complete swept period. In this case, the vibration can be eliminated by averaging the beat frequencies of the adjacent demodulation region. However, in more scenarios where the environmental jitter changes rapidly in real time, these two methods are difficult to compensate for the Doppler frequency drift. By employing two lasers with reversely chirped output optical frequency, the Doppler frequency in a single demodulation region can be obtained by the simple difference between the beat frequencies of the two lasers in the same time period, as illustrated in Fig. 1(d) and Eq. (2). In this way, the real-time compensation can be achieved.

    4.3 Data Acquisition in 3D Ranging Experiment

    The schematic diagram of data acquisition in 3D ranging experiments is shown in Fig. 7(b). Synchronous driving and acquisition process can be achieved by using an arbitrary waveform generator, which is controlled by a computer, to synchronously output the driving signal of PZTs and the trigger signals of the galvo scanners and the data acquisition card. The original driving signal is then amplified and divided into two parts by a power amplifier, and the reversely chirped control can be realized by applying a 180 deg phase shift to one of them. Finally, the auxiliary clock signals and self-mixing signals received by photodetectors are collected by the data acquisition card and sent to a computer for further processing.

    5 Appendix

    5.1 Swept Nonlinearity Suppression of the Dual Self-Mixing Light Sources

    In practical applications, the swept nonlinearity always exists due to various factors, such as fluctuation of modulation circuit, instability of mechanical tensile stress, and temperature vibration, which results in spectral broadening and a peak shift of the beat signal and thus decreases the system precision, as shown in Fig. 8(a). In the proposed reversely chirped self-mixing FMCW lidar system, a resampling-based method, which is widely used in optical coherence tomography (OCT) monitoring the clock signal generated from another independent MZI, is employed to suppress the swept nonlinearity of the light source. The detailed equation is as follows: to provide a more concrete explanation of the nonlinear elimination process of the self-mixing laser, the nonlinear term of the optical frequency is developed into a high-order Tylor series of time t as fnoni(t)=k=2γiktk,i=1,2,where γk is the coefficient of the k’order nonlinear terms and the subscript i stands for different lasers. Then, the optical frequency of the two reverse-chirped self-mixing lasers in the same single demodulation region can be expressed as f1(t)=fo1+αt+fnon1(t),f2(t)=fo2βt+fnon2(t),where f01 and f02 are the initial frequencies of laser 1 and laser 2, respectively, and α and β stand for the corresponding tuning rates. The self-mixing signals, whose frequency can be regarded as a sum of a fixed beat frequency and a fluctuating frequency caused by the swept nonlinearity, can be written as ΔI1(t)Is1=κG(ατ)·cos{2πατt+2π[0tfnon1(t)dt0tτfnon1(t)dt]+ϕs1},ΔI2(t)Is2=κG(βτ)·cos{2πβτt2π[0tfnon2(t)dt0tτfnon2(t)dt]+ϕs2},where κ is the feedback coefficient that is related to the reflectivity of the target, G is the spontaneous gain obtained through the self-mixing process, Is is the free-running output power of the laser, τ is the time delay that is decided by the target distance, and ϕs represents the fixed phase term. By substituting Eq. (3) into Eq. (5), and conducting Taylor expansion of tk+1 at tτ, the self-mixing signal with swept nonlinearity can be written as ΔI1(t)Is1=κG(ατ)·cos[2πt(ατ+k=2γ1ktk1τ)+ϕs1],ΔI2(t)Is2=κG(βτ)·cos[2πt(βτk=2γ2ktk1τ)+ϕs2].

    (a) Schematic of ideal linear swept modulation and actual situation with nonlinearity. (b) Spectrum results of the beat signal targeting a static object and a vibrating object before and after resampling.

    Figure 8.(a) Schematic of ideal linear swept modulation and actual situation with nonlinearity. (b) Spectrum results of the beat signal targeting a static object and a vibrating object before and after resampling.

    It can be observed from Eq. (6) that additional nonlinear terms exist in the beat frequency of the self-mixing signal, which severely affects the extraction of the actual beat frequency fb1 and fb2 (fb1=ατ, fb2=βτ). Suppose that the optical lengths of the two delay fibers are L1 and L2; the corresponding heterodyne interference signals of the MZIs can be expressed as IMZI1(t)=I1cos[2π(L1c)(f01+αtαL12c+k=2γ1ktk)],IMZI2(t)=I2cos[2π(L2c)(f02βt+βL22c+k=2γ2ktk)],where c represents the speed of light. Then, the clock signal can be extracted by finding the equal-phase feature points of the auxiliary MZI interference signal (e.g., peak-valley points). By setting the phase of the MIZ signal to qπ2, (q=0,1,2,,N), the clock signal with a length of N in number can be obtained as Ic1(t)=q=0N1δ(k=2γ1ktkαqc2αL1),Ic2(t)=q=0N2δ(k=2γ2ktkβqc2βL2),where δ(·) stands for the impulse function. After that, the self-mixing signal can be resampled with the clock signal through a convolution operation as follows: ΔI1(q)Is1=ΔI1(t)Is1Ic1(t)=κG(ατ)·cos(2πqτc2L1+ϕs1),ΔI2(q)Is2=ΔI2(t)Is2Ic2(t)=κG(βτ)·cos(2πqτc2L2+ϕs2).

    It can be observed from the above equation that the nonlinear terms no longer exist in the frequency of the resampled self-mixing signal, which means that the target distance can be accurately demodulated from the beat frequency as R1=2L1M1N1,R2=2L2M2N2,where M refers to the peak position of the resampled self-mixing signal in number. The experimental results of the spectrum of self-mixing signals before and after resampling are shown in Fig. 8(b), which shows that the spectrum broadening and SNR are greatly improved through the resampling process, proving the effectiveness of the method. Note that in practical applications, to satisfy the Nyquist sampling theory, the optical length of the delay fiber in MZI is normally selected to be 2 times longer than the target distance that contains fiber distance and absolute distance.

    5.2 Working Principle of Vibration Compensation

    Suppose that the frequency of the output light emitted from the swept laser is modulated linearly; there will be a beat frequency peak related to the delay information and a low-frequency relaxation oscillation peak in the spectrum of the self-mixing signal, as shown in Fig. 1(c). When the target is in a quasi-static state, the beat frequency of the up and down swept region will be equal, which can be addressed as fb=ητ,where η represents the tuning rate. However, in most cases, the vibration of the surrounding environment leads to a Doppler frequency shift fd, which results in a deviation of the actual beat frequency in adjacent regions as shown in the right figure of Fig. 1(b). In this case, the up-swept and down-swept frequency in a single swept can be written as fb(t)={ητfd(t)  ητ+fd(t+T2),(0t<T2).

    This deviation is ignored by the researchers in low-precision imaging scenarios. In some FMCW-based 3D ranging systems, the deviation caused by the Doppler frequency is often suppressed by averaging the beat frequency of the adjacent demodulation region. However, this method is only suitable for environments with little vibration, where the Doppler frequency of the adjacent region is regarded as a constant. In more scenarios, such as outdoor assembly and remote sensing, the effectiveness of the conventional adjacent-averaging method is limited. To achieve a strictly real-time compensation, a configuration with dual reverse-chirped lasers is employed. The frequency of the up-swept and down-swept region of the two reversely chirped lasers can be written as fup1(t)=ατfd(t),fdown1(t+T2)=ατ+fd(t+T2),fdown2(t)=βτ+fd(t),fup2(t+T2)=βτ+fd(t+T2)(0t<T2),where the different numbers in the subscripts represent the different lasers. Then, the final demodulation results can be obtained by averaging the beat frequencies in the same swept region of two reversely chirped lasers, fbc(t)={fup1(t)+fdown2(t)2,(0t<T2)fup2(t)+fdown1(t)2,(T2t<T).

    By substituting Eq. (13) into Eq. (14), the final demodulation distance can be rewritten as L(t)=cτ2={[fup1(t)+fdown2(t)]c(α+β),(0t<T2)[fup2(t)+fdown1(t)]c(α+β),(T2t<T).

    In this way, the Doppler frequency shift can be eliminated effectively. To further simplify the demodulation process, the tuning rate of the two lasers is often kept the same, which can be achieved by setting the driving voltage with the same amplitude and chirp period.

    5.3 Detection Limit Calculation

    The SNR refers to the ratio of the strength of the received useful signal to the strength of the noise. When SNR is equal to unity (or 0 dB), the useful signal and noise are at the same intensity, making it difficult to accurately locate the peak position of the spectrum. Therefore, the detection limit, which refers to the minimum echo power that can be effectively detected by the system, is estimated when the SNR is equal to unity and can be calculated as Pecho=Pprobe·10ATT/10,where Pprobe is the probe power and ATT is the attenuation. To ensure rigor, extra attenuation brought by insertion loss is neglected in numerical calculations. The detection limit can be obtained by substituting the maximum attenuation and probe power into Eq. (16).

    5.4 Imaging Results of Other Objects

    The original intention of choosing geometric objects for 3D imaging, as presented in the previous section, was to more intuitively demonstrate the anti-interference imaging advantages of our system and to better display the data distribution. In addition to these tests, we also conduct 3D imaging experiments on other objects with different materials and shapes, including an artificial tree, a foam snowflake, and a ceramic horse, with the results displayed in Fig. 9. It can be observed that the imaging results rebuild the actual scene with good fidelity, again demonstrating the imaging capability of the system.

    The 3D imaging results of (a) an artificial tree, (b) a foam snowflake, and (c) a ceramic horse; with corresponding photographs shown in (d) for the artificial tree, (e) for the foam snowflake, and (f) for the ceramic horse.

    Figure 9.The 3D imaging results of (a) an artificial tree, (b) a foam snowflake, and (c) a ceramic horse; with corresponding photographs shown in (d) for the artificial tree, (e) for the foam snowflake, and (f) for the ceramic horse.

    Chenxiao Lin received his BS degree in optoelectronic information science and engineering from Tianjin University, Tianjin, China, in 2021. He is currently working toward the PhD with the Department of Precision Instrument, Tsinghua University, Beijing, China. His current research interests include FMCW ranging, iterative algorithm, machine learning, and optical imaging.

    Yifan Wang received his BS degree in optical engineering from Tianjin University, Tianjin, China, in 2018 and received his PhD in the Department of Precision Instrument, Tsinghua University, Beijing, China, in 2023. His current research interests include optical imaging and FMCW LiDAR.

    Yidong Tan is a professor and doctoral supervisor in the Department of Precision Instruments at Tsinghua University. He is a recipient of the Excellent Youth Science Fund of the National Science Foundation of China, Newton advanced fellowship of the Royal Society of UK, the head of the innovation team awarded by the Ministry of Education, the vice president of the Optoelectronic Industry Committee of the China Electronic Information Industry Federation, and the managing director of the Mechanical Testing Instrument Branch of the China Instrument and Control Society. He mainly engages in laser technology and precision measurement applications. He has undertaken more than 40 projects in the field of precision instruments under the National Natural Science Foundation of China, the Ministry of Science and Technology’s Key Research and Development Program, the Military Science and Technology Commission’s foundation strengthening, and major scientific instrument special projects. He has published over 100 papers in journals such as Nature Communications, PhotoniX, Research, Optica, Bioelectronics and Biosensors, and IEEE Transactions on Industrial Electronics, and authorized 37 patents. He has presented more than 60 keynote/binary/invited reports at international conferences and has successively won the Gold Award at the Geneva International Invention Exhibition, the Recommendation Award from the Editor-in-Chief of the Chinese Journal of Lasers, the First Prize for the Technological Invention of the Chinese Society for Optical Engineering, and multiple first and second Prizes for technological invention of the Chinese Institutes of Electronics.

    References

    [1] C. Urmson et al. Autonomous driving in urban environments: boss and the urban challenge. J. Field Rob., 25, 425-466(2008).

    [2] M. Elbakary et al. Aerosol tracking using lidar-based atmospheric profiling and Bayesian estimation. Opt. Laser Technol., 128, 106248(2020).

    [3] S. F. Yu et al. Photon-counting distributed free-space spectroscopy. Light: Sci. Appl., 10, 212(2021).

    [4] R. R. Wang et al. Simultaneous time-varying vibration and nonlinearity compensation for one-period triangular-FMCW Lidar signal. Remote Sens., 13, 1731(2021).

    [5] B Schwarz. LIDAR: mapping the world in 3D. Nat. Photonics, 4, 429-430(2010).

    [6] R. Agishev et al. Range-resolved pulsed and CWFM lidars: potential capabilities comparison. Appl. Phys. B, 85, 149-162(2006).

    [7] R. K. Ula, Y. Noguchi, K. Liyama. Three-dimensional object profiling using highly accurate FMCW optical ranging system. J. Lightwave Technol., 37, 3826-3833(2020).

    [8] A. Martin et al. Photonic integrated circuit-based FMCW coherent LiDAR. J. Lightwave Technol., 36, 4640-4645(2018).

    [9] B. Behroozpour et al. Electronic-photonic integrated circuit for 3D microimaging. J. Solid-State Circuits, 52, 161-172(2017).

    [10] N. Satyan et al. Precise control of broadband frequency chirps using optoelectronic feedback. Opt. Express, 17, 15991-15999(2009).

    [11] Z. Ahmad et al. High-power and high-responsivity avalanche photodiodes for self-heterodyne FMCW lidar system applications. IEEE Access, 9, 85661-85671(2021).

    [12] C. Lu, Z. H. Yu, G. D. Liu. A high-precision range extraction method using an FM nonlinear kernel function for DFB-array-based FMCW lidar. Opt. Commun., 504, 127469(2022).

    [13] C. L. Li, F. M. Zhang, X. H. Qu. High-resolution frequency-modulated continuous-wave LiDAR using multiple laser sources simultaneously scanning. J. Lightwave Technol., 41, 367-373(2023).

    [14] T. Dilazaro, G. Nehmetallah. Large-volume, low-cost, high-precision FMCW tomography using stitched DFBs. Opt. Express, 26, 2891-2904(2018).

    [15] C. Lu et al. FSI-based non-cooperative target absolute distance measurement method using PLL correction for the influence of nonlinear clock. Opt. Lett., 43, 2098-2101(2018).

    [16] Y. F. Wang et al. Frequency-swept feedback interferometry for noncooperative-target ranging with a stand-off distance of several hundred meters. PhotoniX, 3, 21(2022).

    [17] X. S. Zhang, J. Pouls, M. C. Wu. Laser frequency sweep linearization by iterative learning pre-distortion for FMCW LiDAR. Opt. Express, 27, 9965-9974(2019).

    [18] B. Wang et al. Millimeter-resolution long-range OFDR using Xultra-linearly 100 GHz-swept optical source realized by injection-locking technique and cascaded FWM process. Opt. Express, 25, 3514-3524(2017).

    [19] Y. N. Zhi et al. Symmetrical dual-sideband oppositely chirped differential FMCW LiDAR. Opt. Express, 31, 38114-38131(2023).

    [20] F. M. Zhang et al. Vibration compensation of the frequency-scanning-interferometry-based absolute ranging system. Appl. Sci., 9, 147(2019).

    [21] C. Lu et al. Absolute distance measurement system with micron-grade measurement uncertainty and 24 m range using frequency scanning interferometry with compensation of environment vibration. Opt. Express, 24, 30215-30224(2016).

    [22] S. Kakuma, Y. Katase. Frequency scanning interferometry immune to length drift using a pair of vertical-cavity surface-emitting laser diodes. Opt. Rev., 19, 376-380(2012).

    [23] R. R. Wang et al. Time-varying vibration compensation based on segmented interference for triangular FMCW LiDAR signals. Remote. Sens., 13, 3803-3825(2021).

    [24] R. R. Wang et al. Vibration compensation method based on instantaneous ranging model for triangular FMCW lidar signals. Opt. Express, 11, 15918-15939(2021).

    [25] Y. G. Dong et al. Frequency-modulated continuous-wave LIDAR and 3D imaging using linear frequency modulation based on injection locking. J. Lightwave Technol., 39, 3826-3833(2021).

    [26] L. W. Tang et al. Hybrid integrated ultralow-linewidth and fast-chirped laser for FMCW LiDAR. Opt. Express, 30, 30420-30429(2022).

    [27] T. Hariyama et al. High-accuracy range-sensing system based on FMCW using low-cost VCSEL. Opt. Express, 26, 9285-9297(2018).

    [28] E. Baumann et al. Comb-calibrated laser ranging for three-dimensional surface profiling with micrometer-level precision at a distance. Opt. Express, 22, 24914-24928(2014).

    [29] H. Pan, X. H. Qu, F. M. Zhang. Micron-precision measurement using a combined frequency-modulated continuous wave lidar autofocusing system at 60 meters standoff distance. Opt. Express, 26, 15186-15198(2018).

    [30] E. Moore, R. Mcleod. Correction of sampling errors due to laser tuning rate fluctuations in swept-wavelength interferometry. Opt. Express, 16, 13139-13149(2008).

    [31] A. R. Peter et al. Ultrabroadband optical chirp linearization for precision metrology applications. Opt. Lett., 34, 3692-3694(2009).

    [32] F. Ito, X. Fan, Y Koshikiya. Long-range coherent OFDR with light source phase noise compensation. J. Lightwave Technol., 30, 1015-1024(2012).

    [33] X. Y. Fan, Y. Koshikiya, F. Ito. Phase-noise-compensated optical frequency-domain reflectometry. J. Lightwave Technol., 45, 594-602(2009).

    [34] W. H. Yu et al. Comb-calibrated frequency sweeping interferometry for absolute distance and vibration measurement. Opt. Lett., 44, 5069-5072(2019).

    [35] E. Baumann et al. Comb-calibrated frequency-modulated continuous-wave ladar for absolute distance measurements. Opt. Lett., 38, 2026-2028(2013).

    [36] K Otsuka. Effects of external perturbations on LiNdP4O12 lasers. J. Quantum Electron., 15, 655-663(1979). https://doi.org/10.1109/JQE.1979.1070053

    [37] O. Hugon, E. Lacot, F. Stoeckel. Submicrometric displacement and vibration measurement using optical feedback in a fiber laser. Fiber Integr. Opt., 22, 283-288(2003).

    [38] E. Lacot, R. Day, F. Stoeckel. Laser optical feedback tomography. Opt. Lett., 24, 744-746(1999).

    [39] E. Lacot, R. Day, F. Stoeckel. Coherent laser detection by frequency-shifted optical feedback. Phys. Rev. A, 64, 43815-43825(2001).

    [40] K Otsuka. Self-mixing thin-slice solid-state laser metrology. Sensors, 11, 2195-2245(2011).

    [41] Y. Y. Zhao et al. Coherent laser detection of femtowatt-level frequency-shifted optical feedback based on a DFB fiber laser. Opt. Lett., 46, 1229-1232(2021).

    [42] Z. R. Dai et al. Surface plasmon resonance biosensor with laser heterodyne feedback for highly-sensitive and rapid detection of COVID-19 spike antigen. Biosens. Bioelectron., 206, 114163-114168(2022).

    [43] J. S. Tian et al. Ultrasensitive screening of endocrine-disrupting chemicals using a surface plasmon resonance biosensor with polarization-compensated laser heterodyne feedback. Anal. Chem., 95, 8687-8695(2023).

    [44] X. Xu, Z. R. Dai, Y. D. Tan. A dual-beam differential method based on feedback interferometry for noncontact measurement of linear and angular displacement. Trans. Ind. Electron., 70, 6405-6413(2023).

    [45] X. J. Wan, D. Li, S. L. Zhang. Quasi-common-path laser feedback interferometry based on frequency shifting and multiplexing. Opt. Lett., 32, 367-369(2007).

    [46] Z. G. Zhao et al. Narrow laser-linewidth measurement using short delay self-heterodyne interferometry. Opt. Express, 30, 30600-30610(2022).

    [47] E. Fomiryakov et al. New approach to laser characterization using delayed self-heterodyne interferometry. J. Lightwave Technol., 39, 5191-5196(2021).

    [48] Z. Wang et al. Cubic meter volume optical coherence tomography. Optica, 3, 1496-1503(2016).

    [49] Y. F. Wang et al. Laser feedback frequency-modulated continuous-wave LiDAR and 3-D imaging. IEEE Trans. Instrum. Meas., 72, 7002309(2023).

    [50] S. M. Li et al. Chip‐based microwave‐photonic radar for high‐resolution imaging. Laser Photonics Rev., 14, 1900239(2020).

    [51] B. Behroozpour et al. Lidar system architectures and circuits. IEEE Commun. Mag., 55, 135-142(2017).

    [52] X. Y. Jia et al. Frequency-scanning interferometry using a time-varying Kalman filter for dynamic tracking measurements. Opt. Express, 25, 25782-25796(2017).

    [53] Z. A. Wang et al. Frequency-scanning interferometry for dynamic measurement using adaptive Sage-Husa Kalman filter. Opt. Lasers Eng., 165, 107545-107557(2023).

    [54] C Lu et al. Method based on chirp decomposition for dispersion mismatch compensation in precision absolute distance measurement using swept-wavelength interferometry. Opt. Express, 23, 31662-31671(2015).

    Chenxiao Lin, Yifan Wang, Yidong Tan, "High precision and sensitivity anti-interference 3D coherent ranging based on dual reversely chirped self-mixing lasers," Adv. Photon. Nexus 3, 066003 (2024)
    Download Citation