• High Power Laser and Particle Beams
  • Vol. 36, Issue 10, 109001 (2024)
Deqi Cheng1, Yiwei Yang2, Shilan Wang2, Leixun Tang3, and Xiang Wang1,*
Author Affiliations
  • 1College of Nuclear Science and Technology, Harbin Engineering University, Harbin 150001, China
  • 2Institute of Applied Electronics, CAEP, Mianyang 621900, China
  • 3School of Nuclear Science and Technology, University of South China, Hengyang 421001, China
  • show less
    DOI: 10.11884/HPLPB202436.240096 Cite this Article
    Deqi Cheng, Yiwei Yang, Shilan Wang, Leixun Tang, Xiang Wang. Electron FLASH-RT dosimetry simulation and experimental research[J]. High Power Laser and Particle Beams, 2024, 36(10): 109001 Copy Citation Text show less
    Schematic diagram of electron FLASH-RT experimental platform
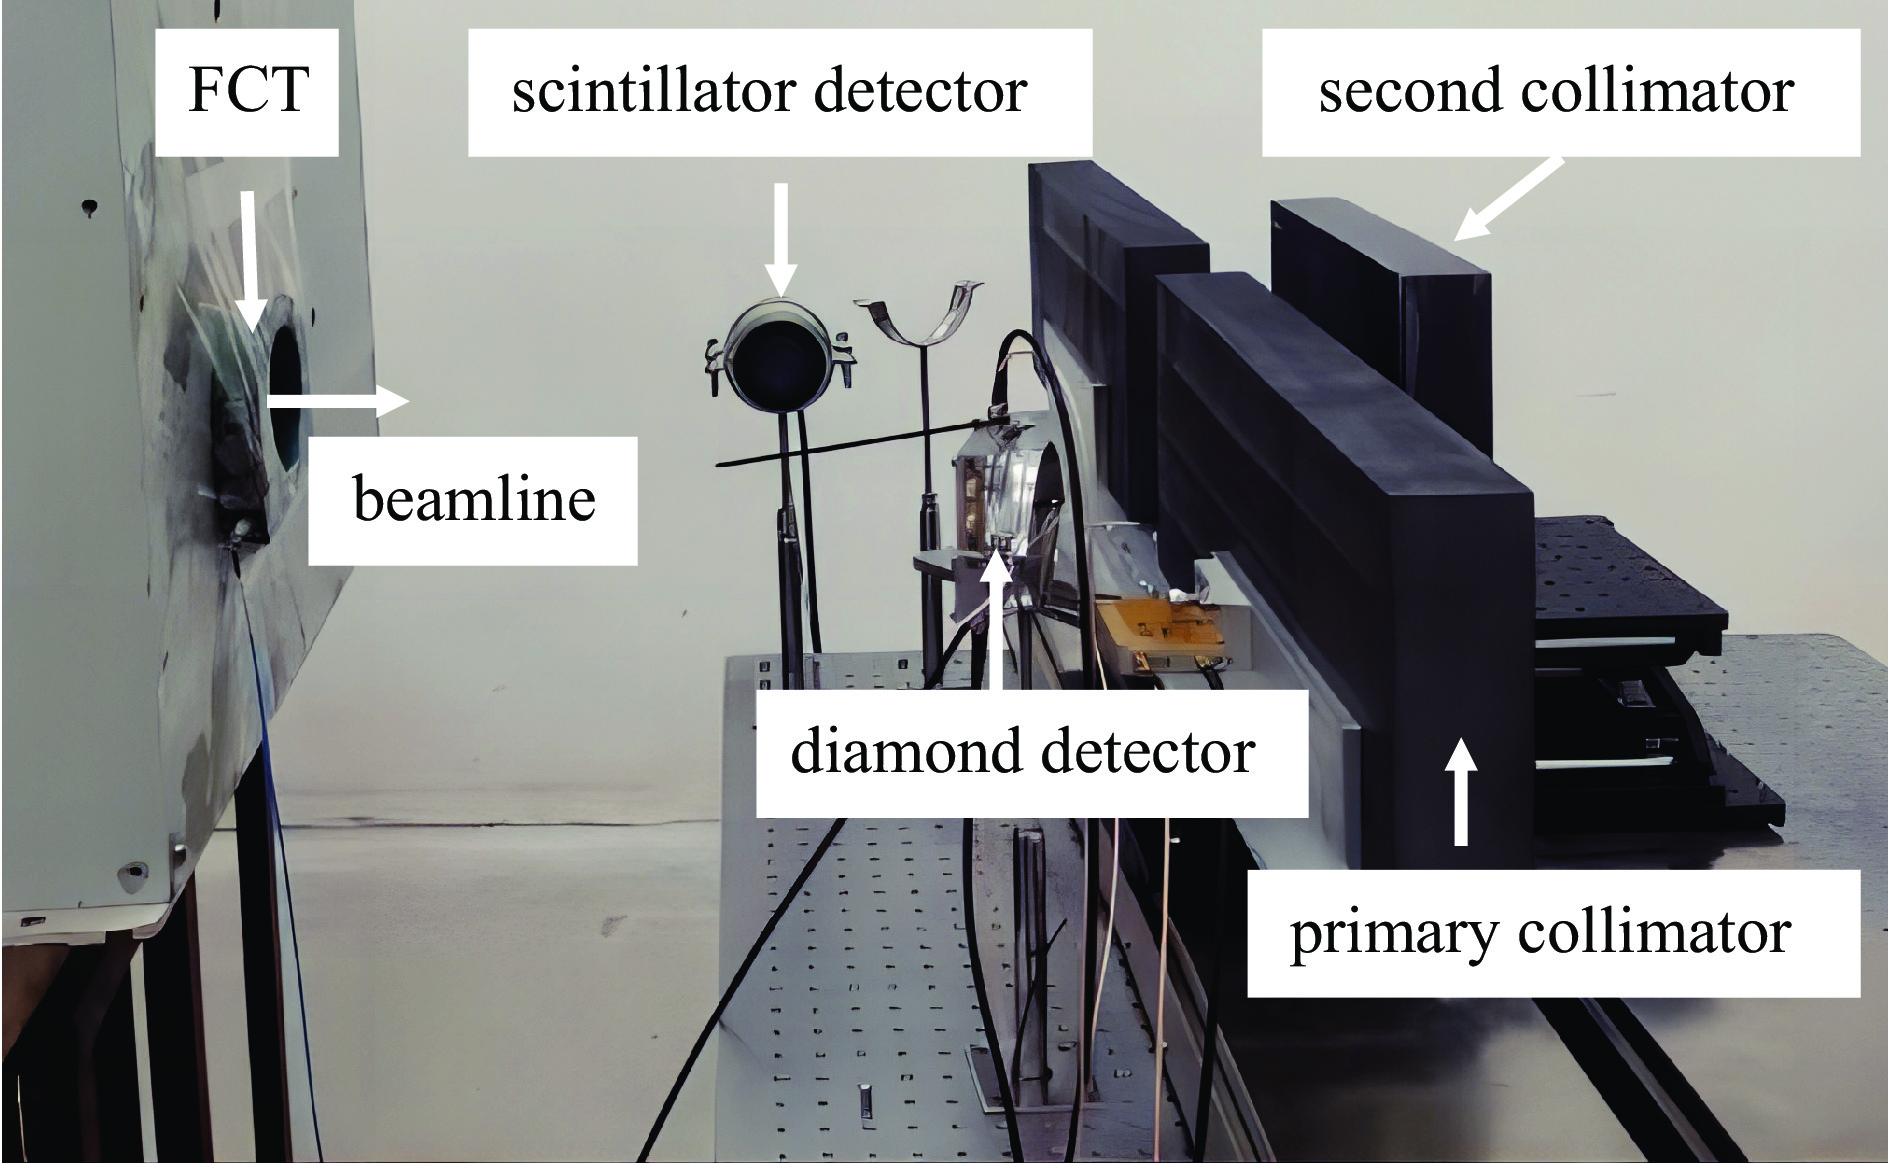
    Fig. 1. Schematic diagram of electron FLASH-RT experimental platform
    Film is placed parallel to the beam direction
    Fig. 2. Film is placed parallel to the beam direction
    Monte Carlo simulation diagram
    Fig. 3. Monte Carlo simulation diagram
    Relative deviation of the dose at different depths under five independent repeated experiments
    Fig. 4. Relative deviation of the dose at different depths under five independent repeated experiments
    Off-axis ratio curves at different water-layer thicknesses
    Fig. 5. Off-axis ratio curves at different water-layer thicknesses
    EBT3 film and MC dose distribution curve
    Fig. 6. EBT3 film and MC dose distribution curve
    Off-axis ratio dose distribution curve of EBT3 film
    Fig. 7. Off-axis ratio dose distribution curve of EBT3 film
    Effect of water-layer thickness on the Percentage Depth Dose (PDD)
    Fig. 8. Effect of water-layer thickness on the Percentage Depth Dose (PDD)
    Depth dose distribution curves of EBT3 film and MC simulation
    Fig. 9. Depth dose distribution curves of EBT3 film and MC simulation
    Two-dimensional dose distribution of EBT3 film and MC simulation
    Fig. 10. Two-dimensional dose distribution of EBT3 film and MC simulation
    PDD curves for electron beams at different energies
    Fig. 11. PDD curves for electron beams at different energies
    PDD of the electron beam varies with field sizes
    Fig. 12. PDD of the electron beam varies with field sizes
    Lateral electron distribution in central-axis field size
    Fig. 13. Lateral electron distribution in central-axis field size
    Off-axis ratio curves under different field sizes
    Fig. 14. Off-axis ratio curves under different field sizes
    Deqi Cheng, Yiwei Yang, Shilan Wang, Leixun Tang, Xiang Wang. Electron FLASH-RT dosimetry simulation and experimental research[J]. High Power Laser and Particle Beams, 2024, 36(10): 109001
    Download Citation