 AI Video Guide
  AI Picture Guide
 AI One Sentence

Huan Zhang, Yutong Yang, Weimin Yang, Zanyang Guan, Xiaoxi Duan, Mengsheng Yang, Yonggang Liu, Jingxiang Shen, Katarzyna Batani, Diluka Singappuli, Ke Lan, Yongsheng Li, Wenyi Huo, Hao Liu, Yulong Li, Dong Yang, Sanwei Li, Zhebin Wang, Jiamin Yang, Zongqing Zhao, Weiyan Zhang, Liang Sun, Wei Kang, Dimitri Batani. Equation of state for boron nitride along the principal Hugoniot to 16 Mbar[J]. Matter and Radiation at Extremes, 2024, 9(5): 057403
- Matter and Radiation at Extremes
- Vol. 9, Issue 5, 057403 (2024)
Note: This section is automatically generated by AI . The website and platform operators shall not be liable for any commercial or legal consequences arising from your use of AI generated content on this website. Please be aware of this.
Abstract
I. INTRODUCTION
Understanding the behavior of boron and its compounds under extreme conditions of high pressure and temperature is important in a number of scientific fields. This behavior plays a fundamental role in the “boron dip” phenomenon,1–3 which is of key importance in stellar nucleosynthesis and other areas of nuclear astrophysics, and its investigation has motivated a number of laboratory experiments.4,5 In addition to this, interest in boron and its compounds has recently grown rapidly for a variety of other reasons. Among these is the possibility of hydrogen–boron (HB) fusion, which has the very desirable characteristic of not producing neutrons, unlike the deuterium–tritium (DT) reaction. Unfortunately, to trigger this reaction in a laboratory plasma, a very high temperature is required, which explains why most fusion research has focused on DT, leaving HB fusion as a remote, although interesting, “second step” in energy production through fusion. However, very recent experiments, using both laser-driven6 and magnetic-confinement approaches,7,8 have reawakened interest in HB fusion, which is currently a very active research field.
Boron compounds are also of great interest in the context of investigations of materials under high-energy-density conditions. In particular, boron nitride (BN) is in many respects similar to carbon. Its two main allotropic phases, hexagonal boron nitride (h-BN) and cubic boron nitride (c-BN), with different initial densities, are similar in structure and mass density to graphite and diamond, respectively. The average atomic and mass numbers (Z and A) of BN are the same as those of carbon. The phase diagram for BN remains experimentally unverified at high pressure, with potential differences from that of carbon, arising from the fact that BN is composed of two elements. Obtaining an understanding the BN phase diagram is an important test of theoretical models of the equation of state of matter (EoS) under extreme conditions.9–11 For this reason, the EoS and the phase transitions of BN have been extensively studied up to pressures of a couple of Mbar (1 Mbar = 100 GPa) using static compression methods (diamond anvil cells).12–14 Some data can also be found in the RUSBANK.15,16
Finally, pure boron and boron compounds are interesting in the context of inertial confinement fusion (ICF),17–19 because they have been proposed as ablators for implosion experiments as an alternative to synthetic diamond (HDC). The nuclear reactions of boron and nitrogen with neutrons, protons, and γ rays offer the potential for additional diagnostic channels to better constrain the shell areal density and ablator mixing during nuclear burn time.20,21 However, the main interest in BN with regard to ICF arises from the fact that the melting temperature and bulk modulus of diamond are very high. Thus, the initial foot in the laser pulse temporal profile used to drive implosion cannot be too low, implying that the shock pressure generated by the initial foot in current experiments is of the order of 10 Mbar, which sets a quite high value of the entropy parameter. Therefore, while diamond has been a key factor in demonstrating fusion breakthrough at the National Ignition Facility (NIF),22 its use can be problematic when attempts are made to achieve high-gain implosions. Hence, the search for alternative ablator materials is important, and, in this respect, BN could be of interest because of its lower melting temperature and bulk modulus.
Despite all these reasons to study the EoS of boron compounds at very high pressure, the available experimental data at pressures greater than 1 Mbar are very scarce. At the OMEGA laser facility, Shuai Zhang and co-workers have obtained only three EoS data of c-BN along the principal Hugoniot above 12 Mbar using the direct-drive approach and transparent monocrystalline samples.23 At the NIF, the same group has measured one experimental point on the shock Hugoniot for pure boron at very high pressure (>56 Mbar) using an indirect-drive.24 The result agreed with a first-principles EoS model that predicts a maximum compression of 4.6, slightly larger than those predicted by the Thomas–Fermi models LEOS 50 and SESAME 2330. Finally, measurements of the EoS of boron carbide (B4C) have been made both at OMEGA25 and at the NIF.26 At OMEGA, indirectly driven shocks were produced using a half-hohlraum. At NIF, seven experimental points were obtained at pressures between 29 and 61 Mbar. Data were compared with theoretical models, demonstrating good agreement with an average-atom model (LEOS 2122).27 Thus, only a few experimental data at high pressure and temperature have been obtained, and they are too limited to constrain theoretical models above a few megabar. In addition, the properties of boron compounds under extreme conditions should be significantly influenced by their varying initial densities.
In this context, we performed an experiment on the SGIII prototype (SGIII-p) laser facility in China28 to study the EoS of BN along the Hugoniot curve with the goals of increasing the available dataset and providing further validation of theoretical models. Also, since the Hugoniots of BN with different initial phases can show significant differences, we used h-BN samples in our experiment. Therefore, our data extend and complement those obtained at OMEGA using c-BN. Our results cover the pressure range between 5 and 16 Mbar, corresponding to a near-threefold compression of h-BN. They also can contribute to understanding the structural complexity in the phase diagram of BN and how the phase changes upon compression. For this reason, in parallel to the experiments, we carried out density functional theory molecular dynamics (DFT-MD) calculations for h-BN, with the results showing good agreement with experimental data. This provides better confidence in model predictions of the physical properties of BN, thereby allowing us to draw conclusions regarding the adaptability of BN as an ablator for ICF experiments, and to assess the efficiency of BN as a boron supplier in HB fusion experiments.
II. LASER SHOCK EXPERIMENT
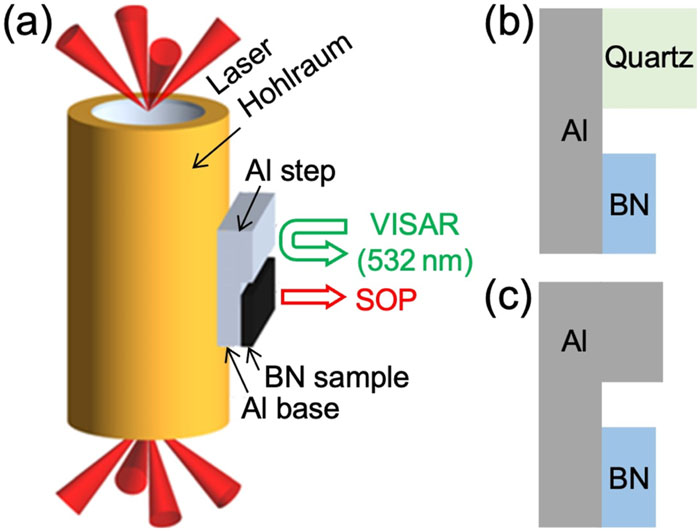
A laser shock compression experiment for h-BN was conducted at the SGIII-p laser facility,28,29 located at the Laser Fusion Research Center (LFRC) in Mianyang, China. The system operates with a Nd:glass laser at a wavelength of 351 nm through frequency-tripling. Eight laser beams were smoothed by distributed phase plates, producing a focus spot of 500 µm diameter. They deliver a flat-top laser (UV, 351 nm) pulse with a duration of 2–4 ns and an energy up to 6400 J into the entrance holes of a cylindrical gold hohlraum. A multilayer step-target package was attached to the side, as depicted in Fig. 1. The uniform intense radiation field created inside the hohlraum irradiated the Al pusher of the target package, leading to the generation of a strong shock wave that propagated through both the BN sample and the reference materials. Time-resolved X-ray radiation temperatures were measured by flat-response X-ray diodes (FXRDs).30,31 Two types of hohlraum were used in this experiment to cover a broader shock pressure range. The details of the hohlraum and samples are given in the supplementary material.
![]()
Figure 1.(a) Schematic of experimental configuration. The planar sample package is attached to the side of the hohlraum. Two types of sample packages were used. (b) The first type consists of an Al pusher plate, the BN sample, and the quartz standard to measure the
Hexagonal BN samples compressed from high purity h-BN powder were used in the present experiment. The BN samples with initial density 2.04–2.05 g/cm3 were provided by the LFRC target group and by the company Scitech Precison, UK. As shown in Fig. 1, two types of samples were used to obtain shock Hugoniot EoS data by the impedance matching (IM) technique.32–34 The first type consisted of an Al base (pusher) and two samples of Al (reference material) and BN, in the shape of steps (Al–BN–Al). The second type was Al–BN–quartz, which provided a detailed history of the shock velocity in the quartz (and hence indirectly in the BN). A thin Al film (of the order of 100 nm) was coated on the rear surface of the BN sample to provide a reflecting signal for the line velocity interferometer system for any reflector (VISAR) diagnostic.35
The primary ultrafast diagnostics used in the experiment were the VISAR, with a 532 nm probe laser, and a streaked optical pyrometer (SOP) system,36–38 which measured time-resolved thermal emission. Figure 2 shows the signals from the Al–BN–quartz and Al–BN–Al samples recorded by VISAR and SOP. The shock breakout times from the Al base and the BN sample were recorded simultaneously. As quartz becomes reflective above 1.5 Mbar,39 the fringe shift in the VISAR images provides a one-dimensional history of the shock velocity in the quartz.
![]()
Figure 2.Experimental configurations and typical data from the shots. The surface reflection and thermal emission signals were recorded by VISAR and SOP, for the Al base, BN sample, and quartz/Al-step standards. (a) Schematic of Al–BN–quartz-type EoS target. (b) Time-resolved VISAR and (c) SOP data for shot 043 using this type of target.
The initial densities were 2.65 g/cm3 for quartz and 2.70 g/cm3 for Al (reference material). The refractive index of quartz at 532 nm is 1.547. In this experiment, we used two VISAR channels with different velocity sensitivities. Their respective etalons were 5.007 and 6.972 mm thick, corresponding to respective velocity sensitivities of 6.433 and 4.620 km/s per fringe in the quartz. To analyze the VISAR images, we used the Fourier transform method proposed in Ref. 35, which provides the phase shifts resulting from changes in velocity. The uncertainty in determining the phase was estimated as 5% of a fringe, which resulted in an uncertainty of ∼1% for shock velocities. The VISAR system used two streak cameras with 10 ns sweep duration, resulting in temporal sensitivities of ∼20 ps.
III. THEORETICAL DFT-MD RESULTS
The Hugoniot of h-BN can be obtained from the EoS data calculated using the DFT-MD method.40,41 The principal Hugoniot is calculated through the Rankine–Hugoniot relation:
In Fig. 3(a), we show the Hugoniots of BN for selected values of E0. The curve begins in the cubic phase at low compression ratio, and, with further compression, it enters the fluid region. While the Hugoniot curve is not very sensitive to the initial pressure P0 (since the generally P1 ≫ P0), it is sensitive to the initial-state internal energy E0, as shown in Fig. 3(a). We have chosen the value of E0 = −38.44 Ry that best fits the experimental data of RUSBANK (ρ0 = 2.08 g/cm3 and T0 = 300 K)16 at low pressure as the initial-state internal energy (which is much higher than the E0 for pure h-BN of −38.59 Ry and pure c-BN of −38.60 Ry), and it reproduces the experimental data under high pressure well.
![]()
Figure 3.Theoretical calculations of BN EoS at high pressures using the DFT-MD method, compared with previous results. (a) Principal Hugoniot calculated with three different choices of initial energy density
Moreover, BN is assumed in the cubic phase to reproduce the RUSBANK experimental data before melting, implying that the porous h-BN sample undergoes a phase transition to the cubic phase before it melts. This phase transition along the Hugoniot is also well illustrated in the phase diagram displayed in Fig. 3(b). The blue dotted and solid lines in Fig. 3(b) represent the phase diagrams of BN measured in previous experiments. Here, we adopt the same method as de Koker42 to calculate the melting curve between the cubic solid phase and liquid phase of BN. The melting curve starts from the triple point of the cubic–hexagonal–liquid phases of BN. The temperature Ttri = 3472.0 K and pressure Ptri = 0.069 42 Mbar of the triple point are determined as the averages of the measurements of Corrigan and Bundy43 and those of Solozhenko.44 The melting temperature TM at higher pressure is then determined by integrating the Clapeyron equation
for the slope of the melting curve, where ΔV is the volume change between the two phases and ΔS is the change in entropy. In the DFT-MD calculation, we first calculate the internal energy E and volume V of BN in both liquid and cubic solid phases at the pressure and temperature of a known state point on the melting curve, such as the triple point. ΔV is calculated as the volume difference of the two phases, and ΔS is calculated through the energy difference ΔE together with ΔV via ΔS = (ΔE + PΔV)/T. The next point on the melting curve can then be calculated by integrating Eq. (2) with a small step in ΔP. When this procedure is repeated, the entire melting curve between the c-BN and liquid phases can be obtained.
Figure 3(b) displays the calculated Hugoniot curve and the equilibrium melting curve together with phase boundaries between h-BN and c-BN from previous experiments. It can be seen that the porous h-BN is compressed into the cubic phase at ∼0.1 Mbar, and melts along the cubic–liquid phase boundary at a pressure ∼1 Mbar. This shows that the melting temperature of h-BN along the principal Hugoniot is ∼4800 K. Note that the equilibrium phase boundaries calculated thermodynamically are usually lower than the boundaries deduced from experimental Hugoniot data without considering the dynamical effects associated with overcoming the energy barriers in phase transitions under dynamical shock compression.
All the DFT-MD calculations are performed using the Quantum ESPRESSO package.45 The local-density-approximation (LDA)46 version of the exchange-correlation functional is used, and pseudopotentials for boron and nitrogen elements are generated using the ATOMPAW program47 in a projected-augmented-wave (PAW) form.48 The core cutoff radii for both elements are 1.4 Bohr, with all electrons in the L shell treated as active electrons, and the cutoff for plane-wave energy in the calculation is 140 Ry. The EoS data are calculated with 216 atoms in a simulation box. The Brillouin zone is sampled with the Γ point.
We follow the routines described in previous works49–54 to calculate EoS tables and Hugoniots. The EoS calculations are performed in canonical ensembles (NVT ensembles), where the ion temperatures are controlled by the velocity-rescaling technique. Electrons follow the Fermi–Dirac distribution at the given T. The time step is 0.4–0.8 fs, which is less than the duration that it takes for an ion to traverse the average interatomic distance at its thermal velocity divided by a factor of l, which in this work is set to be 60, i.e.,
IV. ANALYSIS AND DISCUSSION
As illustrated in Fig. 2, we did not observe any fringe shift in VISAR from the Al base, and there is no obvious thermal emission recorded in SOP images before the shock breakout. This indicates that the preheating effect of X rays by indirect drive (heating the sample to a temperature lower than the melting temperature of Al) was negligible. Also, both VISAR and SOP images show that the produced shock front was spatially very flat (except at the very edges of the shock front, where some curvature was expected), and so the uncertainly due to shock nonplanarity can also be ignored in our experimental measurement.
In the case of Al–BN–quartz targets, as described in Figs. 2 and 4, the average shock velocity
![]()
Figure 4.Analysis of VISAR and SOP data for the Al–BN–quartz target in shot 043. The upper panel shows time-resolved SOP counts in the Al base, BN sample, and quartz standard.
We applied the correction method for nonstationary shocks.32–34,55 For the opaque BN sample, we considered the fluctuations of shock velocities to be similar to those of transparent quartz, if driven by the same radiation source.25,34 Thus, the evolution history for shock velocity in opaque BN could be inferred from the shock velocity history in quartz. Then, the average shock velocity
The SOP images in Fig. 2 show that the thermal emission from the BN step was observed before shock breakout and was initially weak but then increased with time. This was probably due to the lower-than-nominal density of our h-BN samples, which implies that the material had some porosity. Therefore, the emission from the shock inside BN through the uncompressed material ahead of the shock front could be observed at certain distances. The signal then increased as the shock approached the rear surface, reducing the thickness of the uncompressed BN layer. After the shock breakout, the emission vanished, owing to the rapid expansion and cooling of the released material on the rear side of the target, as illustrated in Fig. 4. For the Al step, the usual behavior was observed, and no thermal emission appeared before shock breakout. In this case, the shock breakout time for Al was measured at the half-height of the rising slope in the SOP intensity history, and that for BN was measured at the half-height of the descending edge, as shown in Fig. 4.
The shock velocity in the Al base was calculated with the IM technique using the shock velocity in quartz combined with the EoS of quartz and Al. For the principal Hugoniot of Al, we used the piecewise-linear form of the Us − up relationship from Celliers et al. (Ref. 56), which gives
![]()
Figure 5.IM analysis in the pressure vs particle velocity plane for a typical shot using the Al–BN–quartz target (shot 046). The state of the quartz in this shot is determined by the intersection of the Hugoniot curve with the measured quartz Rayleigh line [plot (1)]. The Al release line going through this point is then determined. The intersections with the standard Al Hugoniot and the measured BN Rayleigh line determine the states of Al and BN along the respective Hugoniot [plot (2)]. Uncertainty ranges are shown by the dashed lines. The main source of errors in the IM analysis comes from the shock velocity measurements.
To reduce possible systematic errors from using Al–BN–quartz targets, in which the shock velocity in the Al base was not directly measured, the Al–BN–Al targets were shocked under the same radiation sources. Time-resolved X-ray radiation temperatures recorded by FXRDs are shown in Fig. 6. The radiation temperatures measured with Al–BN–Al targets (solid lines) and Al–BN–quartz targets (dotted lines) were indeed very close. The maximum deviation of 2% in temperature profiles was within the ∼3% diagnostic uncertainty. Therefore, the quartz shock velocity history measured in the Al–BN–quartz sample can be used as the basis for correcting the nonstationary effects in the Al–BN–Al samples. The high reproducibility of the radiation temperatures ensures the reliability of the analysis.
![]()
Figure 6.Time-resolved X-ray radiation temperatures measured in the shots, illustrating the reproducibility of the X-ray drive. The unsteady-shock corrections calculated for the Al–BN–quartz shots 044 and 048 (solid lines) can be used in the Al–BN–Al shots 047 and 050 (dotted lines), respectively.
Figure 7 illustrates shock-breakout signals extracted from the raw data for Al–BN–Al targets. The shock breakout times from the Al base, from the BN sample, and from the Al step were measured from the same image. Only the Al standard was used as reference material in the IM analysis described in previous works.33,55 The average shock velocity in the Al step,
![]()
Figure 7.Data analysis for the Al–BN–Al target in shot 047. The time-resolved VISAR and SOP counts in the Al base, BN, and Al are plotted.
The measured shock Hugoniot data in the two types of targets are listed in Tables I and II, respectively. In these experiments, h-BN samples with initial densities of 2.04 g/cm3 and 2.05 g/cm3 were compressed to a shocked density of 5.00–6.05 g/cm3, corresponding to compression ratios of ∼2.5 to 3. The Hugoniot data obtained by two different IM routes show good consistency, adding confidence in the reliability of the experimental results. The uncertainty of the shock velocity in Al is less than 1%, while the maximum uncertainty of the shock velocity in BN is 2.2%. In Table I, the greatest uncertainty in the shock velocity for BN corresponds to shot 048. This is due to the large surface roughness in BN samples, as shown in Tables S3 and S4 (supplementary material). Figure 8 presents experimental and theoretical Hugoniot curves of BN for three different initial densities: the results from Zhang et al.,23 the RUSBANK data,16 and our data. These correspond to 3.45, 2.08, and 2.04 g/cm3 initial densities, respectively.
| Shot | PBN (Mbar) | |||||
|---|---|---|---|---|---|---|
| 043 | 23.91 ± 0.54 | 25.69 ± 0.22 | 14.91 ± 0.45 | 16.03 ± 0.22 | 8.35 ± 0.29 | 2.66 ± 0.18 |
| 044 | 22.87 ± 0.36 | 24.45 ± 0.22 | 14.02 ± 0.31 | 15.01 ± 0.43 | 7.53 ± 0.22 | 2.61 ± 0.13 |
| 046 | 31.27 ± 0.79 | 34.12 ± 0.32 | 21.22 ± 0.67 | 22.61 ± 0.95 | 15.74 ± 0.67 | 2.97 ± 0.25 |
| 048 | 20.04 ± 0.27 | 21.38 ± 0.63 | 11.60 ± 0.31 | 12.49 ± 0.35 | 5.47 ± 0.18 | 2.40 ± 0.16 |
| 051 | 19.70 ± 0.26 | 20.70 ± 0.16 | 11.30 ± 0.22 | 12.25 ± 0.31 | 5.17 ± 0.13 | 2.45 ± 0.10 |
Table 1. Shock Hugoniot data obtained from the Al–BN–quartz targets.
| Shot | PBN (Mbar) | |||||
|---|---|---|---|---|---|---|
| 047 | 24.18 ± 0.14 | 25.87 ± 0.19 | 15.14 ± 0.12 | 16.30 ± 0.23 | 8.60 ± 0.12 | 2.70 ± 0.08 |
| 050 | 21.84 ± 0.15 | 23.16 ± 0.19 | 13.14 ± 0.13 | 14.19 ± 0.21 | 6.71 ± 0.10 | 2.58 ± 0.07 |
Table 2. Shock Hugoniot data obtained from the Al–BN–Al target.
![]()
Figure 8.Comparisons of theoretical BN Hugoniots with shock experiments. The data are presented in (a) the
Figure 8 compares the theoretical and experimental BN Hugoniot data under shock compression. The measured Hugoniot data in this work are highly consistent with our DFT-MD simulations for 2.04 g/cm3. In the pressure–compression ratio relation, our experimental results and DFT-MD calculations also agree well. Our experimental results provide a strong constraint on theoretical models of the BN EoS up to 16 Mbar.
V. CONCLUSIONS
In the experiments described here, high-pressure data for the shock Hugoniot of h-BN were for the first time obtained in the range 5–16 Mbar using the SGIII-p laser facility. These data complement the existing datasets for h-BN at low pressure (from RUSBANK) and c-BN at high pressure (from OMEGA experiments), filling a gap in present knowledge of the properties of boron and its compounds at extreme pressures. In parallel to the experiments, our DFT-MD calculations provide results that are in very good agreement with available Hugoniot data. This gives confidence in the validity of DFT-MD results under conditions of extremely high pressures and temperatures. The melting temperature of h-BN along the principal Hugoniot in the calculations is almost a factor of two below the melting temperature of diamond along its Hugoniot.58 Thus, detecting high-pressure melting for BN and determining the melting curves under laser shock compression experiments in the future work is an important task with regard to exploring the possibility of using boron compound materials as ablators in inertial confinement experiments to improve implosion performance. From the point of view of materials science, our calculations imply a phase transition from h-BN to c-BN at a pressure of ∼0.1 Mbar. It will also be interesting to extend the DFT-MD calculations at relatively low temperature to investigate the presence of other high-pressure phases and perform experiments in this range with newly developed in situ X-ray diffraction techniques at high-power laser or X-ray free-electron laser facilities in the near future.59 Our results provide fundamental scientific insight into the structural complexity of the BN phase plane under extreme conditions, which is of interest for inertial confinement fusion, hydrogen–boron fusion, and high-energy-density physics.
SUPPLEMENTARY MATERIAL
The supplementary material provides details of the targets and samples, the unsteady correction and F factor, and the uncertainties in sample thickness.
ACKNOWLEDGMENTS
Acknowledgment. We thank Ji Yan, Lifeng Wang, and Weichao Tong for helpful discussions. We acknowledge the crucial contributions from the SGIII-Prototype laser management, staff, and support team for shots and from the target fabrication team for providing the targets. This work is supported by the National Natural Science Foundation of China under Grant No. 12035002. D.B. is a Visiting Professor at Peking University.
References
[3] A. M.Boesgaard, A.McWilliam, and A.McWilliam, M.Rauch. The light elements lithium, beryllium and boron. Origin and Evolution of the Elements, 117(2004).
[16] S. P.Marsh. LASL Shock Hugoniot Data(1980).
[21] G. M.Hale, A. C.Hayes-Sterbenz, G.Jungman, M. W.Paris. Probing the Physics of Burning DT Capsules Using Gamma-Ray Diagnostics(2015).
[29] K.Lan. Dream fusion in octahedral spherical hohlraum. Matter Radiat. Extremes, 7, 055701(2022).
[41] P.Hohenberg, W.Kohn. Inhomogeneous electron gas. Phys. Rev., 136, B864-B871(1964).
[48] P. E.Blöchl. Projector augmented-wave method. Phys. Rev. B, 50, 17953-17979(1994).
[55] X.Duan, L.Sun, Z.Wang, Q.Ye, C.Zhang et al. A method for impedance-match experiments with unsteady shock loading, (unpublished)(2024).


Set citation alerts for the article
Please enter your email address

© Copyright 2018-2021 | Chinese Laser Press. All Rights Reserved 沪ICP备15018463号-20