AI Video Guide
  AI Picture Guide
 AI One Sentence
Colored dissolved organic matter (CDOM) plays a pivotal role in the global carbon cycle and climate change. The rapid development of satellite remote sensing technology has provided a vast amount of ocean surface remote sensing data for oceanographic research, reflecting the internal state of the ocean to a certain extent. We combine multi-source ocean remote sensing data with deep learning techniques to propose a remote sensing inversion method for subsurface CDOM in the ocean. This method inverses the vertical distribution of subsurface CDOM by employing ocean surface remote sensing data, thus providing a new perspective and theoretical support for a deeper understanding of the mechanisms of the ocean carbon cycle and its interactions with climate change.
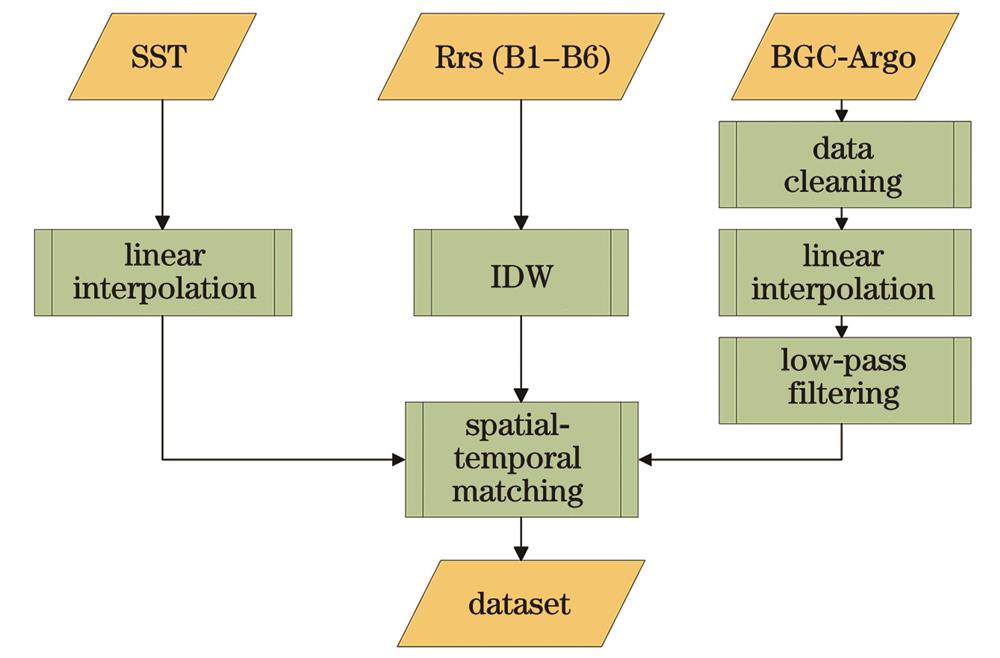
Firstly, the CDOM profile data obtained from BGC-Argo is preprocessed to address the uncertain vertical resolution. By conducting linear interpolation, the data is standardized to an interval of 1 m, ensuring consistency in depth between data points for subsequent analysis. Additionally, a low-pass filter is adopted to reduce peak fluctuations in the data, enhancing its smoothness and reliability. To address the missing ocean remote sensing data, we employ the inverse distance weighting (IDW) interpolation method, effectively filling in missing values in remote sensing images. The K-fold cross-validation method is utilized to evaluate the interpolation model, with the mean absolute percentage error (MAPE) selected as the evaluation metric. Given the spatial resolution mismatch between sea surface temperature (SST) data and remote sensing reflectance data, the bilinear interpolation algorithm is employed to reconstruct the resolution of the SST dataset, enhancing its resolution and ensuring spatio-temporal consistency of the model input data. Finally, based on the convolutional neural network (CNN) model, we design a subsurface CDOM inversion model for the ocean, adopting multi-band remote sensing reflectance, SST, and other parameters as inputs. This model consists of an input module, a CNN feature extraction module, and a prediction module, enabling the vertical distribution prediction of subsurface CDOM concentration in the ocean. As a result, the model’s applicability is evaluated via a test set and two independent test areas.
The filtered profile data of CDOM of the ocean exhibits smoother and more stable characteristics, effectively eliminating the interference of outliers on the overall data trend (Fig. 3). To achieve spatio-temporal consistency between BGC-Argo data and remote sensing reflectance data, we employ the IDW method to interpolate missing values in remote sensing reflectance images and validate the spatial interpolation model through K-fold cross-validation. By taking the Rrs443 remote sensing data from the first day of each month in 2020 as an example, the initial distribution of remote sensing data is shown in Fig. 4, while the reconstructed remote sensing data after IDW spatial interpolation is presented in Fig. 5. During cross-validation, the K value is set to 5, with the MAPE employed as the evaluation criterion. The results indicate that the overall error of the interpolation model remains below 30%, demonstrating the sound performance of the interpolation model. The proposed inversion model achieves a root mean square error (RMSE) of 0.14 μg/L, a correlation coefficient (r) of 0.73, and a coefficient of determination (R2) of 0.74 in the test set. Furthermore, in the validation of two independent test areas, the RMSE values are 0.13 μg/L and 0.18 μg/L respectively, with r values of 0.81 and 0.74, and R2 values of 0.79 and 0.69 respectively. By analyzing the vertical distribution plots of predicted and actual values for independent test zones A and B (Figs. 8 and 9), combined with the residual scatter plot between predicted and actual values (Fig. 10), it is evident that the predicted values are mostly concentrated around the y=x diagonal with the actual values. This result demonstrates a high degree of consistency between the model’s predictions and the measured CDOM distribution characteristics, thereby confirming the validity and applicability of the proposed model. The correlation between the distribution of CDOM and SST is explored via the subsurface CDOM-SST scatter plot (Fig. 11), which further validates the rationality of the inversion results.
We leverage multi-band ocean remote sensing spectral data (B1: Rrs412; B2: Rrs443; B3: Rrs490; B4: Rrs510; B5: Rrs560; B6: Rrs665), SST remote sensing data, and BGC-Argo data, combined with a CNN model, to develop an inversion model for the vertical distribution of marine subsurface CDOM in the Northwest Pacific region (131°E?180°E, 26°N?54°N). To validate the accuracy of this model, we evaluate the performance of this model by adopting a test set, proving the model’s sound performance. Additionally, to further verify the model’s applicability, we conduct predictions for the vertical distribution of CDOM in two independent test areas, which reveals a high degree of consistency between the predicted and measured CDOM distribution characteristics, thereby proving the model’s effectiveness in presenting the vertical distribution characteristics of marine subsurface CDOM. Meanwhile, an analysis of the vertical distribution characteristics of subsurface CDOM in the Northwest Pacific region is conducted by utilizing the constructed vertical distribution maps of CDOM in the independent test areas. Notably, the mass concentrations in spring and summer are significantly higher than those in autumn and winter, with CDOM mass concentrations gradually increasing with depth. As a crucial component of the oceanic carbon cycle, the distribution and variation of CDOM significantly influence this cycle. We not only uncover these key features of the vertical distribution of marine subsurface CDOM but also provide a solid theoretical foundation and support for its inversion, facilitating a deeper understanding and prediction of the dynamic changes in the oceanic carbon cycle. However, our study has certain limitations. For instance, the IDW remote sensing data reconstruction method based on spatial correlation can be further optimized by incorporating factors such as time series to enhance the model’s ability to capture dynamic temporal changes. Additionally, considerations can be given to adjusting the model structure, increasing network depth, and exploring the inclusion of additional remote sensing parameters such as sea surface elevation and wind speed to delve deeper into the complex relationship between ocean remote sensing data and the vertical distribution of marine subsurface CDOM and improve prediction accuracy.