
Lang Yu, Xiangjun Li, Dexian Yan. Enhanced Terahertz Absorption Spectrum Based on One‐Dimensional Photonic Crystal Defect Modes with Metal‐Dielectric Periodic Structures[J]. Acta Optica Sinica, 2025, 45(5): 0530002
- Acta Optica Sinica
- Vol. 45, Issue 5, 0530002 (2025)
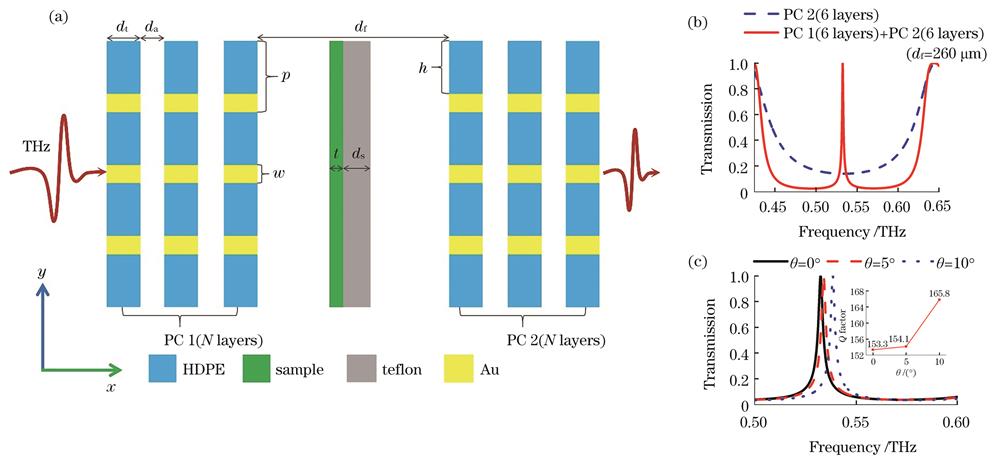
Fig. 1. Enhanced terahertz absorption spectrum structure based on one-dimensional photonic crystal defect modes of metal-dielectric periodic structures, and its influence on transmission spectrum. (a) Schematic diagram of structure; (b) transmission spectra of one-dimensional photonic crystal structure and defective one-dimensional photonic crystal structure; (c) transmission spectra of defective one-dimensional photonic crystal structure changing with tilt angle

Fig. 2. Influence of designed structure on spectra of 1.0 μm α-lactose film. (a) Transmission and reflection spectra without α-lactose; (b) transmission and reflection spectra with 1.0 μm α-lactose film; (c) real and imaginary parts of dielectric constant of lactose at 0.48‒0.58 THz; (d) absorption spectra
Fig. 3. Influences of metal structures and N value on enhanced absorption spectra. (a)‒(d) Influences of metal structures on enhanced absorption spectra; (e)‒(f) influences of metal structures on maximum electric field intensity
Fig. 4. Electric field distributions at resonant peaks with or without metal structures. (a) Without metal structures; (b) with metal structures
Fig. 5. Electric field intensity of designed structure. (a) Electric field distributions without α-lactose at different resonance peaks; (b) electric field distributions with α-lactose at different resonance peaks; (c) maximum electric field intensities corresponding to different heights h without α-lactose; (d) comparison of resonance peak intensities
Fig. 6. Influences of N on enhanced absorption spectra. (a)‒(e) N=3‒7; (f) comparisons of results of enhanced absorption spectra with different N from (a)‒(e)
Fig. 7. Influences of α-lactose film thickness t on enhanced absorption spectra. (a)‒(e) t=0.2‒1.0 μm; (f) comparisons of results of enhanced absorption spectra with different t from (a)‒(e)
Fig. 8. Influences of dielectric height h on enhanced absorption spectra. (a)‒(e) h=10‒70 μm; (f) comparisons of results of enhanced absorption spectra with different h from (a)‒(e)
Fig. 9. Influences of metal width w on enhanced absorption spectra. (a)‒(e) w=1‒5 μm; (f) comparisons of results of enhanced absorption spectra with different w from (a)‒(e)
|
Table 1. Comparison of operational performance among similar structures and designed structures


Set citation alerts for the article
Please enter your email address

© Copyright 2018-2021 | Chinese Laser Press. All Rights Reserved 沪ICP备15018463号-20