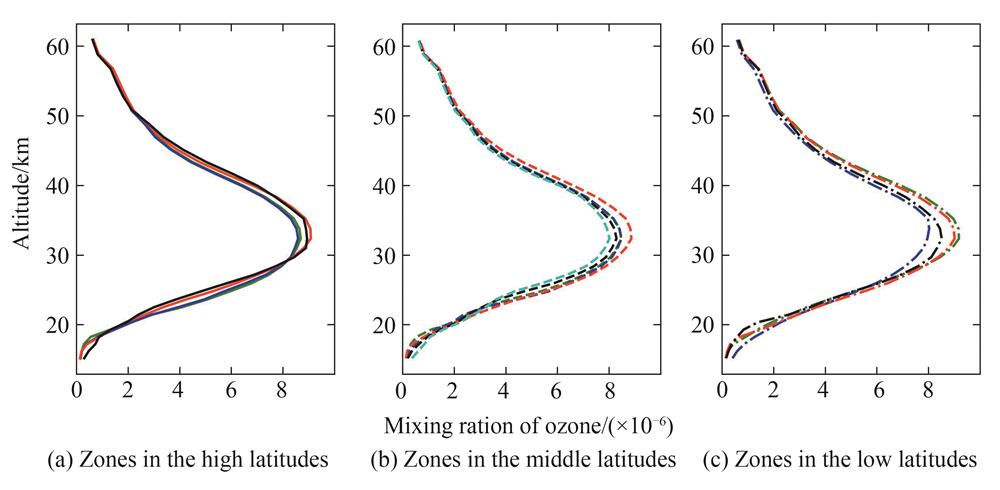
Fig. 1. Changes in ozone profiles in typical high,middle and low latitude zones on March 16
Fig. 2. Changes in ozone profiles in typical high,middle and low latitude regions on July 16
Fig. 3. Changes in ozone profiles in typical high,middle and low latitude regions on October 16
Fig. 4. Changes in ozone profiles in typical high,middle and low latitude regions on January 16
Fig. 5. Changes of ozone profiles at different times in the three northeastern provinces,five southwestern provinces and three central provinces
Fig. 6. Schematic diagram of inversion idea
Fig. 7. The spring relative difference between the inversion results and the TROPOMI Level 2 products with ground-based measurement data
Fig. 8. The summer relative difference between the inversion results and the TROPOMI Level 2 products with ground-based measurement data
Fig. 9. The autumn relative difference between the inversion results and the TROPOMI Level 2 products with ground-based measurement data
Fig. 10. The winter relative difference between the inversion results and the TROPOMI Level 2 products with ground-based measurement data
Fig. 11. The spring relative difference between the inversion results and the TROPOMI Level 2 products with OMPS_LP Level 2 products in the Xizang region
Fig. 12. The summer relative difference between the inversion results and the TROPOMI Level 2 products with OMPS_LP Level 2 products in the Xizang region
Fig. 13. The autumn relative difference between the inversion results and the TROPOMI Level 2 products with OMPS_LP Level 2 products in the Xizang region
Fig. 14. The winter relative difference between the inversion results and the TROPOMI Level 2 products with OMPS_LP Level 2 products in the Xizang region
Fig. 15. The spring relative difference between the inversion results and the TROPOMI Level 2 products with OMPS_LP Level 2 products in the Southeast region
Fig. 16. The summer relative difference between the inversion results and the TROPOMI Level 2 products with OMPS_LP Level 2 products in the Southeast region
Fig. 17. The autumn relative difference between the inversion results and the TROPOMI Level 2 products with OMPS_LP Level 2 products in the Southeast region
Fig. 18. The winter relative difference between the inversion results and the TROPOMI Level 2 products with OMPS_LP Level 2 products in the Southeast region
| Parameters styles | Parameters |
|---|
| Latitude and Longitude | (22.31°N,114.17°E) | | Date established | 1951.01.01 | | Ozonesonde operations began | 1993.10 | | Altitude | 65 m | | Station type | Land(fixed) | | Station class | Radiation station | | Time zone | UTC+8 | | Climate zone | Warm temperate-dry winter-hot summer |
|
Table 1. The details of Hong Kong King′s Park ozonesonde station
| Name | Database parameters | Range |
|---|
| Temporal Resolution | Winter/spring | December,January,February/March,April,May | | Summer/autumn | June,July,August/September,October,November | Spatial Resolution | Northern hemisphere polar latitude | 60° N~90° N | | Northern hemisphere midlatitude | 30° N~60° N | | Tropical latitude | 30° N~30° S | | Southern hemisphere midlatitude | 30° S~60° S | | Southern hemisphere polar latitude | 60° S~90° S | Type of ozone (Class interval of 30 DU) | Northern hemisphere polar latitude | Summer/autumn (220~430 DU) | Winter/spring(220~550 DU) | | Northern hemisphere midlatitude | Summer/autumn (220~430 DU) | Winter/spring(220~550 DU) | | Tropical latitude | All year(190~340 DU) | | Southern hemisphere midlatitude | Summer/autumn (220~370 DU) | Winter/spring(130~430 DU) | | Southern hemisphere polar latitude | Summer/autumn (190~370 DU) | Winter/spring(130~370 DU) |
|
Table 2. The structure of the ozone climatology constructed by LAMSAL L N et al.
| Zones type | Latitude | Longitude |
|---|
| Zones in the high latitude | 40.0 | 115.0 | | 42.0 | 87.5 | | 42.0 | 112.5 | | 46.0 | 130.0 | | Zones in the middle latitude | 30.0 | 102.5 | | 32.0 | 120.0 | | 34.0 | 115.0 | | 36.0 | 117.5 | | 38.0 | 107.5 | | Zones in the low latitude | 16.0 | 117.5 | | 22.0 | 115.0 | | 24.0 | 112.5 | | 26.0 | 107.5 |
|
Table 3. Longitude and latitude of typical zones at high,middle and low latitudes in China
| January 19 | March 16 | August 18 | October 19 |
|---|
| TpO3 inversion results | results GEOS-Chem inversion | results TpO3 inversion | results GEOS-Chem inversion | results TpO3 inversion | results GEOS-Chem inversion | results TpO3 inversion | results GEOS-Chem inversion | | Difference of peak concentration | 5.10×10¹¹ | 3.20×10¹¹ | 6.50×10¹¹ | 4.00×10¹¹ | -2.40×10¹¹ | -2.50×10¹¹ | 2.50×10¹¹ | 1.40×10¹¹ | | Difference of mean concentration | 1.97×10¹¹ | 1.26×10¹¹ | 2.87×10¹¹ | 1.75×10¹¹ | 1.21×10¹¹ | 6.42×10¹⁰ | 1.65×10¹¹ | 8.99×10¹⁰ | | Difference of standard deviation | 1.51×10¹¹ | 8.67×10¹⁰ | 2.41×10¹¹ | 1.52×10¹¹ | -3.25×10¹⁰ | -1.19×10⁹ | 2.37×10¹⁰ | 2.50×10⁸ | | R2 | 0.948 | 0.980 | 0.951 | 0.972 | 0.978 | 0.989 | 0.977 | 0.989 |
|
Table 4. Comparison of TpO3 inversion results and GEOS-Chem inversion results with the ground-based measurements(molecules/cm3)
| Season | Month | Day |
|---|
| Spring | March | 01/08/15/22/29 | | April | 06/12/9 | | May | 03/10/18/25/31 | | Summer | June | 12/21 | | July | 05/21/26 | | August | 02/09/16/23/30 | | Autumn | September | 05/13/20/27 | | October | 13/20/25 | | November | 02/08/16/2/29 | | Winter | December | 06/13/20/29 | | January | 04/11/18/26 | | February | 01/08/15/22 |
|
Table 5. Specific time of ground-based ozonesonde data at Hong Kong station
| / | Median value of from ground-based observations/% | Standard deviation of from ground-based observations/% | UV radiation caused by different ozone products |
|---|
| / | TROPOMI Product | GEOS-Chem Inversion results | TROPOMI Product | GEOS-Chem Inversion results | TROPOMIProduct/(×10-6 W·nm-1·m-2) | GEOS-Chem Inversion results/(×10-6 W·nm-1·m-2) | Rate of change/% | | March | 2.53 | 2.33 | 16.83 | 10.82 | 4.35 | 6.71 | -54.25 | | April | 10.04 | 5.32 | 15.36 | 10.08 | 1.37 | 2.33 | -70.07 | | May | 3.19 | 2.04 | 16.04 | 10.61 | 2.04 | 3.20 | -56.86 |
|
Table 6. The spring relative difference statistics between inversion results and TROPOMI level 2 products and ground-based measured data and ultraviolet radiation changes
| / | Median value of from ground-based observations/% | Standard Deviation of from ground-based observations/% | UV radiation caused by different ozone products |
|---|
| / | TROPOMI Product | GEOS-Chem Inversion results | TROPOMI Product | GEOS-Chem Inversion results | TROPOMI Product/(×10-6)W·nm-1·m-2 | GEOS-Chem Inversion results/(×10-6)W·nm-1·m-2 | Rate of change/% | | June | 6.03 | 3.33 | 15.27 | 11.90 | 2.91 | 4.10 | -40.89 | | July | -1.32 | -0.93 | 11.10 | 7.61 | 2.92 | 3.09 | -5.82 | | August | 4.40 | 3.68 | 12.50 | 8.51 | 1.55 | 1.65 | -6.45 |
|
Table 7. The summer relative difference statistics between inversion results and TROPOMI level 2 products and ground-based measured data and ultraviolet radiation changes
| / | Median value of from ground-based observations/% | Standard Deviation of from ground-based observations/% | UV radiation caused by different ozone products |
|---|
| / | TROPOMI Product | GEOS-Chem Inversion results | TROPOMI Product | GEOS-Chem Inversion results | TROPOMI Product/(×10-6)W·nm-1·m-2 | GEOS-Chem Inversion results/(×10-6)W·nm-1·m-2 | Rate of change/% | | September | 0.48 | 0.85 | 15.94 | 9.41 | 2.87 | 2.92 | -1.74 | | October | 14.63 | 7.45 | 14.46 | 10.16 | 3.10 | 4.31 | -39.03 | | November | 1.63 | 0.56 | 14.99 | 10.06 | 2.01 | 2.46 | -22.39 |
|
Table 8. The autumn relative difference statistics between inversion results and TROPOMI level 2 products and ground-based measured data and ultraviolet radiation changes
| / | Median value of from ground-based observations/% | Standard Deviation of from ground-based observations/% | UV radiation caused by different ozone products |
|---|
| / | TROPOMI Product | GEOS-Chem Inversion results | TROPOMI Product | GEOS-Chem Inversion results | TROPOMI Product/ (×10-6)W·nm-1·m-2 | GEOS-Chem Inversion results/(×10-6)W·nm-1·m-2 | Rate of change/% | | December | 4.64 | 3.47 | 17.79 | 11.82 | 2.80 | 3.36 | -20.00 | | January | 10.72 | 6.44 | 18.46 | 12.10 | 1.92 | 2.88 | -50.00 | | February | 13.25 | 10.44 | 16.74 | 11.06 | 1.38 | 2.17 | -57.25 |
|
Table 9. The winter relative difference statistics between inversion results and TROPOMI level 2 products and ground-based measured data and ultraviolet radiation changes
| January 5 | March 4 | August 19 | October 5 |
|---|
| results TpO3 inversion | results GEOS-Chem inversion | results TpO3 inversion | results GEOS-Chem inversion | results TpO3 inversion | results GEOS-Chem inversion | results TpO3 inversion | results GEOS-Chem inversion | | Difference of peak concentration | -1.05×10¹² | -7.97×10¹¹ | -1.02×10¹² | -8.78×10¹¹ | -7.92×10¹¹ | -4.81×10¹¹ | -7.29×10¹¹ | -5.23×10¹¹ | | Difference of mean concentration | -1.37×10¹¹ | -7.32×10¹⁰ | -1.10×10¹¹ | -3.95×10¹⁰ | -2.43×10¹¹ | -1.46×10¹¹ | 5.33×10⁹ | 2.46×10¹⁰ | | Difference of standard deviation | -2.26×10¹¹ | -1.58×10¹¹ | -1.59×10¹¹ | -1.10×10¹¹ | -2.77×10¹¹ | -1.76×10¹¹ | -1.06×10¹¹ | -5.87×10¹⁰ | | R2 | 0.973 | 0.986 | 0.980 | 0.984 | 0.980 | 0.994 | 0.964 | 0.985 |
|
Table 10. Comparison of TpO3 inversion results and GEOS-Chem inversion results with the OMPS_LP products(molecules/cm3)
| / | Mean value of from OMPS_LP Level 2 products/% | Standard Deviation of from OMPS_LP Level 2 products/% | UV radiation caused by different ozone products |
|---|
| / | TROPOMI Product | GEOS-Chem Inversion results | TROPOMI Product | GEOS-Chem Inversion results | TROPOMI Product/(×10-6)W·nm-1·m-2 | GEOS-Chem Inversion results/(×10-6)W·nm-1·m-2 | Rate of change/% | | March 21 | -0.38 | -0.39 | 13.56 | 9.37 | 3.90 | 3.55 | 9.86 | | April 29 | -0.72 | -0.13 | 14.69 | 8.30 | 3.90 | 2.64 | 47.73 | | May 15 | 3.01 | 1.83 | 13.42 | 8.04 | 1.57 | 1.54 | 1.95 |
|
Table 11. The spring relative difference statistics between inversion results and TROPOMI level 2 products
| / | Mean value of from OMPS_LP Level 2 products/% | Standard Deviation of from OMPS_LP Level 2 products/% | UV radiation caused by different ozone products |
|---|
| / | TROPOMI Product | GEOS-Chem Inversion results | TROPOMI Product | GEOS-Chem Inversion results | TROPOMI Product/(×10-6)W·nm-1·m-2 | GEOS-Chem Inversion results/(×10-6)W·nm-1·m-2 | Rate of change/% | | June 16 | 0.69 | 0.63 | 10.85 | 6.90 | 1.79 | 1.57 | 14.01 | | July 18 | -3.57 | -2.11 | 12.36 | 8.32 | 2.10 | 1.44 | 45.83 | | August 30 | -0.03 | 0.63 | 12.29 | 6.65 | 1.69 | 1.23 | 37.40 |
|
Table 12. The summer relative difference statistics between inversion results and TROPOMI level 2 products and OMPS_LP Level 2 products,as well as ultraviolet radiation changes in the Xizang region
| / | Mean value of from OMPS_LP Level 2 products/% | Standard Deviation of from OMPS_LP Level 2 products/% | UV radiation caused by different ozone products |
|---|
| / | TROPOMI Product | GEOS-Chem Inversion results | TROPOMI Product | GEOS-Chem Inversion results | TROPOMI Product/(×10-6)W·nm-1·m-2 | GEOS-Chem Inversion results/(×10-6 W·nm-1·m-2) | Rate of change/% | | September 20 | -1.54 | -1.74 | 15.62 | 8.06 | 5.50 | 3.66 | 50.27 | | October 6 | 2.88 | 0.98 | 16.42 | 8.51 | 1.62 | 1.30 | 24.62 | | November 7 | 4.12 | 1.92 | 17.25 | 8.94 | 1.52 | 1.22 | 24.59 |
|
Table 13. The autumn relative difference statistics between inversion results and TROPOMI level 2 products and OMPS_LP Level 2 products,as well as ultraviolet radiation changes in the Xizang region
| / | Mean value of from OMPS_LP Level 2 products/% | Standard Deviation of from OMPS_LP Level 2 products/% | UV radiation caused by different ozone products |
|---|
| / | TROPOMI Product | GEOS-Chem Inversion results | TROPOMI Product | GEOS-Chem Inversion results | TROPOMI Product/(×10-6 W·nm-1·m-2) | GEOS-Chem Inversion results/(×10-6 W·nm-1·m-2) | Rate of change/% | | December 25 | 9.65 | 6.06 | 22.88 | 14.31 | 4.07 | 3.76 | 8.24 | | January 7 | 7.61 | 5.07 | 19.24 | 12.82 | 3.01 | 2.91 | 3.44 | | February 8 | -2.46 | -1.51 | 16.77 | 10.74 | 1.94 | 1.36 | 42.65 |
|
Table 14. The winter relative difference statistics between inversion results and TROPOMI level 2 products and OMPS_LP Level 2 products,as well as ultraviolet radiation changes in the Xizang region
| / | Mean value of from OMPS_LP Level 2 products/% | Standard Deviation of from OMPS_LP Level 2 products/% | UV radiation caused by different ozone products |
|---|
| / | TROPOMI Product | GEOS-Chem Inversion results | TROPOMI Product | GEOS-Chem Inversion results | TROPOMI Product/(×10-6 W·nm-1·m-2) | GEOS-Chem Inversion results/(×10-6 W·nm-1·m-2) | Rate of change/% | | March 20 | 0.00 | 0.29 | 9.09 | 5.63 | 1.95 | 1.97 | -1.03 | | April 21 | -4.56 | -2.44 | 11.61 | 6.76 | 2.75 | 2.06 | 33.50 | | May 7 | -7.51 | -4.01 | 12.34 | 6.42 | 1.95 | 1.55 | 25.81 |
|
Table 15. The spring relative difference statistics between inversion results and TROPOMI level 2 products and OMPS_LP Level 2 products,as well as ultraviolet radiation changes in the Southeast region
| / | Mean value of from OMPS_LP Level 2 products/% | Standard Deviation of from OMPS_LP Level 2 products/% | UV radiation caused by different ozone products |
|---|
| / | TROPOMI Product | GEOS-Chem Inversion results | TROPOMI Product | GEOS-Chem Inversion results | TROPOMI Product/(×10-6 W·nm-1·m-2) | GEOS-Chem Inversion results/(×10-6 W·nm-1·m-2) | Rate of change/% | | June 24 | 6.48 | 4.32 | 11.58 | 8.09 | 1.34 | 1.90 | -41.79 | | July 10 | 3.67 | 2.48 | 12.54 | 6.76 | 2.66 | 2.86 | -7.52 | | August 27 | 1.79 | 1.43 | 9.53 | 6.20 | 2.91 | 3.12 | -7.22 |
|
Table 16. The summer relative difference statistics between inversion results and TROPOMI level 2 products and OMPS_LP Level 2 products,as well as ultraviolet radiation changes in the Southeast region
| / | Mean value of from OMPS_LP Level 2 products/% | Standard Deviation of from OMPS_LP Level 2 products/% | UV radiation caused by different ozone products |
|---|
| / | TROPOMI Product | GEOS-Chem Inversion results | TROPOMI Product | GEOS-Chem Inversion results | TROPOMI Product/(×10-6 W·nm-1·m-2) | GEOS-Chem Inversion results/(×10-6 W·nm-1·m-2) | Rate of change/% | | September 28 | -0.22 | -0.39 | 10.92 | 6.68 | 3.93 | 3.48 | 12.93 | | October 14 | -1.84 | -1.27 | 8.76 | 5.45 | 3.00 | 2.96 | 1.35 | | November 15 | 1.26 | 0.77 | 12.18 | 7.04 | 1.81 | 1.49 | 21.48 |
|
Table 17. The autumn relative difference statistics between inversion results and TROPOMI level 2 products and OMPS_LP Level 2 products,as well as ultraviolet radiation changes in the Southeast region
| / | Mean value of from OMPS_LP Level 2 products/% | Standard Deviation of from OMPS_LP Level 2 products/% | UV radiation caused by different ozone products |
|---|
| / | TROPOMI Product | GEOS-Chem Inversion results | TROPOMI Product | GEOS-Chem Inversion results | TROPOMI Product/(×10-6 W·nm-1·m-2) | GEOS-Chem Inversion results/(×10-6 W·nm-1·m-2) | Rate of change/% | | December 1 | -10.66 | -7.93 | 11.46 | 8.20 | 3.87 | 3.29 | 17.69 | | January 15 | -4.52 | -3.08 | 10.77 | 6.85 | 1.05 | 1.00 | 5.00 | | February 16 | -4.27 | -2.50 | 11.69 | 6.82 | 7.31 | 5.51 | 32.67 |
|
Table 18. The winter relative difference statistics between inversion results and TROPOMI level 2 products and OMPS_LP Level 2 products,as well as ultraviolet radiation changes in the Southeast region