
Yuxuan Li, Yanping Huang, Jingjiang Xu, Jia Qin, Lin An, Gongpu Lan. Advances in Linear-Wavenumber Spectral Domain Optical Coherence Tomography[J]. Laser & Optoelectronics Progress, 2025, 62(8): 0800004
- Laser & Optoelectronics Progress
- Vol. 62, Issue 8, 0800004 (2025)
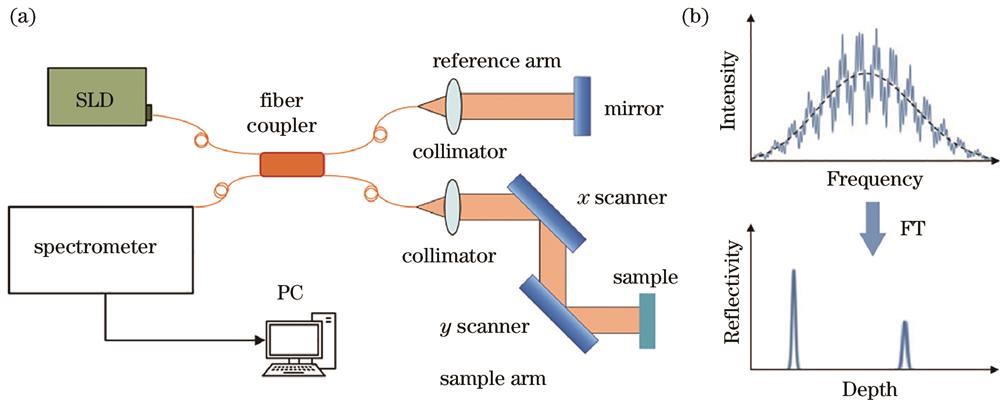
Fig. 1. Principle of SD-OCT. (a) General construction of SD-OCT system; (b) Fourier transform converts the interference signal into a depth signal
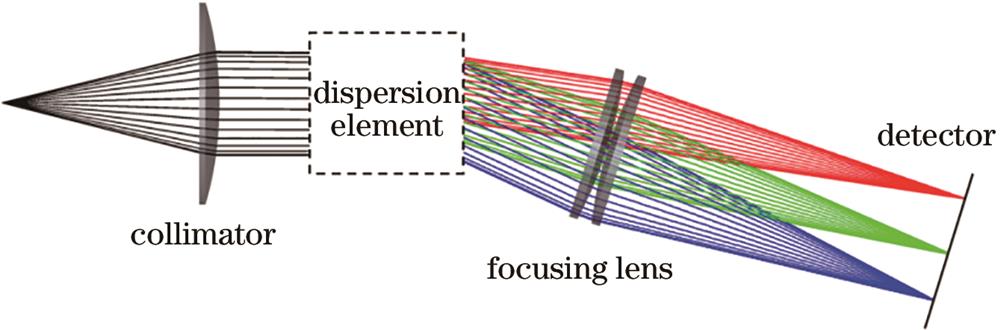
Fig. 2. Spectrometer general structure diagram
Fig. 3. Effect of camera pixel on imaging depth and sensitivity roll-off[34]. (a) Retinal depth imaging with 2048 pixel camera; (b) retina depth imaging with 1024 pixel camera; (c) comparison of imaging depth and signal attenuation for the cameras with different pixel numbers
Fig. 4. Influence of nonlinear sampling on interference spectrum. (a) Relationship between spectral width and sampling interval in interference signal; (b) analog interference spectrum in k space[42]; (c) normalized sensitivity attenuation comparison with or without interpolation in linear wavelength sampling[42]
Fig. 5. Dispersion elements. Single dispersion elements: (a) reflective grating; (b) transmission grating; (c) prism. Complex dispersion elements: (d) triple compound prisms; (e) double gratings; (f) compact grism; (g) separate grating prism combination
Fig. 6. Comparison of sensitivity roll-off between linear-wavenumber spectrometer and linear-wavelength spectrometer[17]
Fig. 7. Examples showing structure imaging. (a) (b) In vivo imaging of human fingers[23,26]; (c) iris structure imaging[48]
Fig. 8. Applications of linear-wavenumber OCT in blood flow imaging. (a)(b) OCTA imaging of dark brown iris based on horizontal and vertical rapid scans[48]; (c)‒(f) large-field and small-field imaging of nail fold microvascular structure based on OCTA[50]; (g) retinal OCTA imaging by the NIR channel[51]
Fig. 9. Applications of linear-wavenumber OCT in elastic imaging. (a) OCE system mainly consists of OCT and excitation modules; (b) single degree-of-freedom model mainly includes mass, stiffness, and damping; (c) propagation of mechanical waves (shear and longitudinal wave); (d) elastic hysteresis represents the energy difference between loading excitation and unloading excitation[57]; (e) damping oscillation curve of natural frequency, where fn is natural frequency, ε is damping ratio, φ is phase value, A is original amplitude, and yA(t) is displacement[60]; (f) propagation of silicone corneal shear waves in time-space domain in different directions[56]; (g) evaluation of elastic hysteresis in a beef shank sample[57]; (h) evaluation of spatial distribution of natural frequency in a beef shank sample[62]


Set citation alerts for the article
Please enter your email address

© Copyright 2018-2021 | Chinese Laser Press. All Rights Reserved 沪ICP备15018463号-20