• Acta Optica Sinica
  • Vol. 45, Issue 6, 0601007 (2025)
Saifen Yu1,2, Zhen Zhang1,2,*, and Haiyun Xia1,2
Author Affiliations
  • 1School of Atmospheric Physics, Nanjing University of Information Science and Technology, Nanjing 210044, Jiangsu , China
  • 2National Center of Carbon Metrology (Fujian), Nanping 353011, Fujian , China
  • show less
    DOI: 10.3788/AOS241372 Cite this Article Set citation alerts
    Saifen Yu, Zhen Zhang, Haiyun Xia. Sensitivity Analysis of Simultaneous Remote Sensing of Carbon Dioxide and Water Vapor Isotope Using LiDAR[J]. Acta Optica Sinica, 2025, 45(6): 0601007 Copy Citation Text show less
    Mixture absorption spectra of CO2 and H2O at sea level under six atmospheric models in MODTRAN based on HITRAN database. (a) Tropic; (b) mid-latitude summer; (c) mid-latitude winter; (d) sub-arctic summer; (e) sub-arctic winter; (f) 1976 U.S. standard
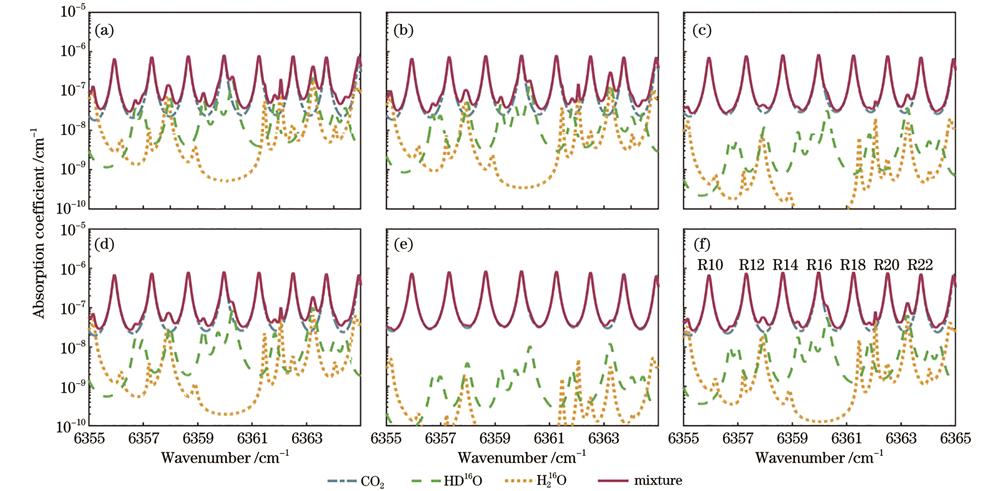
    Fig. 1. Mixture absorption spectra of CO2 and H2O at sea level under six atmospheric models in MODTRAN based on HITRAN database. (a) Tropic; (b) mid-latitude summer; (c) mid-latitude winter; (d) sub-arctic summer; (e) sub-arctic winter; (f) 1976 U.S. standard
    Mixture gases absorption spectra of R16 line under standard condition of T=296 K and p=1013 hPa
    Fig. 2. Mixture gases absorption spectra of R16 line under standard condition of T=296 K and p=1013 hPa
    FWHM of spectral collision broadening and Doppler broadening at R16 line as functions of altitude. (a) CO2; (b) HD16O
    Fig. 3. FWHM of spectral collision broadening and Doppler broadening at R16 line as functions of altitude. (a) CO2; (b) HD16O
    Relative weight of CO2 and HD16O as a function of pressure at different frequency positions
    Fig. 4. Relative weight of CO2 and HD16O as a function of pressure at different frequency positions
    One-way optical depth spectra of R16 as functions of altitude. (a) Mixture gases of CO2 and HD16O; (b) CO2
    Fig. 5. One-way optical depth spectra of R16 as functions of altitude. (a) Mixture gases of CO2 and HD16O; (b) CO2
    Inversion errors of column concentration and range resolved concentration of CO2 and HD16O as functions of altitude under the 1976 U.S. standard atmospheric model
    Fig. 6. Inversion errors of column concentration and range resolved concentration of CO2 and HD16O as functions of altitude under the 1976 U.S. standard atmospheric model
    Concentration error as a function of frequency offset for +1 K temperature variation (Different colors represent errors at different relative frequencies and altitudes. The navy blue lines indicate the variation in errors with relative frequency at several typical altitudes, with the corresponding error values displayed on the right axis. The red dashed line represents the neutral point where the error value is zero). (a) CO2 column concentration error; (b) HD16O column concentration error; (c) CO2 range resolved concentration error; (d) HD16O range resolved concentration error
    Fig. 7. Concentration error as a function of frequency offset for +1 K temperature variation (Different colors represent errors at different relative frequencies and altitudes. The navy blue lines indicate the variation in errors with relative frequency at several typical altitudes, with the corresponding error values displayed on the right axis. The red dashed line represents the neutral point where the error value is zero). (a) CO2 column concentration error; (b) HD16O column concentration error; (c) CO2 range resolved concentration error; (d) HD16O range resolved concentration error
    Concentration error as a function of relative frequency for -0.5 hPa pressure variation (Different colors represent errors at different relative frequencies and altitudes. The navy blue lines indicate the variation in errors with relative frequency at several typical altitudes, with the corresponding error values displayed on the right axis. The red dashed line represents the neutral point where the error value is zero). (a) CO2 column concentration error; (b) HD16O column concentration error; (c) CO2 range resolved concentration error; (d) HD16O range resolved concentration error
    Fig. 8. Concentration error as a function of relative frequency for -0.5 hPa pressure variation (Different colors represent errors at different relative frequencies and altitudes. The navy blue lines indicate the variation in errors with relative frequency at several typical altitudes, with the corresponding error values displayed on the right axis. The red dashed line represents the neutral point where the error value is zero). (a) CO2 column concentration error; (b) HD16O column concentration error; (c) CO2 range resolved concentration error; (d) HD16O range resolved concentration error
    CO2 column concentration error as a function of relative frequency for +0.5 hPa pressure variation (Different colors represent errors at different relative frequencies and altitudes. The red dashed line represents the neutral point with zero sensitivity. The solid and dashed lines in navy blue represent column concentration errors of CO2 at altitudes of 0 km and 60 km, respectively, and the corresponding error values are displayed on the right axis)
    Fig. 9. CO2 column concentration error as a function of relative frequency for +0.5 hPa pressure variation (Different colors represent errors at different relative frequencies and altitudes. The red dashed line represents the neutral point with zero sensitivity. The solid and dashed lines in navy blue represent column concentration errors of CO2 at altitudes of 0 km and 60 km, respectively, and the corresponding error values are displayed on the right axis)
    Concentration error as a function of relative frequency for +1 MHz frequency drift (Different colors represent errors at different relative frequencies and altitudes. The navy blue lines indicate the variation in errors with relative frequency at several typical altitudes, with the corresponding error values displayed on the right axis. The red dashed line represents the neutral point where the error value is zero). (a) CO2 column concentration error; (b) HD16O column concentration error; (c) CO2 range resolved concentration error; (d) HD16O range resolved concentration error
    Fig. 10. Concentration error as a function of relative frequency for +1 MHz frequency drift (Different colors represent errors at different relative frequencies and altitudes. The navy blue lines indicate the variation in errors with relative frequency at several typical altitudes, with the corresponding error values displayed on the right axis. The red dashed line represents the neutral point where the error value is zero). (a) CO2 column concentration error; (b) HD16O column concentration error; (c) CO2 range resolved concentration error; (d) HD16O range resolved concentration error
    Concentration error as a function of relative frequency for 5% H2O mixing ratio variation under atmospheric models of tropic, mid-latitude summer, mid-latitude winter, sub-arctic summer, sub-arctic winter, and 1976 U.S. standard. (a)‒(f) CO2 column concentration error; (g)‒(l) CO2 range resolved concentration error
    Fig. 11. Concentration error as a function of relative frequency for 5% H2O mixing ratio variation under atmospheric models of tropic, mid-latitude summer, mid-latitude winter, sub-arctic summer, sub-arctic winter, and 1976 U.S. standard. (a)‒(f) CO2 column concentration error; (g)‒(l) CO2 range resolved concentration error
    ModelPressure /MbarTemperature /KDensity /cm-3

    Mixing ratio of

    CO2 /10-6

    Mixing ratio of

    H216O /10-6

    Mixing ratio of

    HD16O /10-6

    11013299.72.450×1019420259008.05
    21013294.22.496×1019420188005.86
    31018272.22.711×101942043201.45
    41010287.22.549×1019420119003.71
    51013257.22.855×101942014100.44
    61013288.22.548×101942077502.42
    Table 1. Atmospheric parameters of MODTRAN model at sea level
    Formula

    Wavenumber

    ν /cm-1

    Line intensity S /[cm-1/(molecule·cm-2)]Broadening αPressure shift
    γair /(cm-1·atm-1γself /(cm-1·atm-1δair /(cm-1·atm-1δself /(cm-1·atm-1
    CO26359.96721.761×10-230.0740.102-0.563×10⁻²-0.599×10⁻²
    HD16O6360.27838.619×10-260.0950.448-0.135×10⁻¹
    HD16O6359.74772.218×10-260.0970.394-0.786×10⁻²
    Table 2. Spectral parameters of CO2 and HD16O for R16 line[29]
    Saifen Yu, Zhen Zhang, Haiyun Xia. Sensitivity Analysis of Simultaneous Remote Sensing of Carbon Dioxide and Water Vapor Isotope Using LiDAR[J]. Acta Optica Sinica, 2025, 45(6): 0601007
    Download Citation