• Acta Optica Sinica
  • Vol. 45, Issue 5, 0515002 (2025)
Lei Deng1,2, Guihua Liu1,2,*, Huiming Huang1,2, Hao Deng3..., Wei Rao1,2 and Tianci Liu1,2|Show fewer author(s)
Author Affiliations
  • 1School of Information Engineering, Southwest University of Science and Technology, Mianyang 621010, Sichuan , China
  • 2Key Laboratory of Special Environment Robotics of Sichuan Province, Mianyang 621010, Sichuan , China
  • 3Mianyang Teachers’ College, Mianyang 621006, Sichuan , China
  • show less
    DOI: 10.3788/AOS241884 Cite this Article Set citation alerts
    Lei Deng, Guihua Liu, Huiming Huang, Hao Deng, Wei Rao, Tianci Liu. Stereo Matching of Binocular Multi-Line Laser Stripes Based on Regional Consistency and Voting Scoring Mechanism[J]. Acta Optica Sinica, 2025, 45(5): 0515002 Copy Citation Text show less
    Comparison of laser point matching methods. (a) Matching based on epipolar constraint; (b) proposed matching method
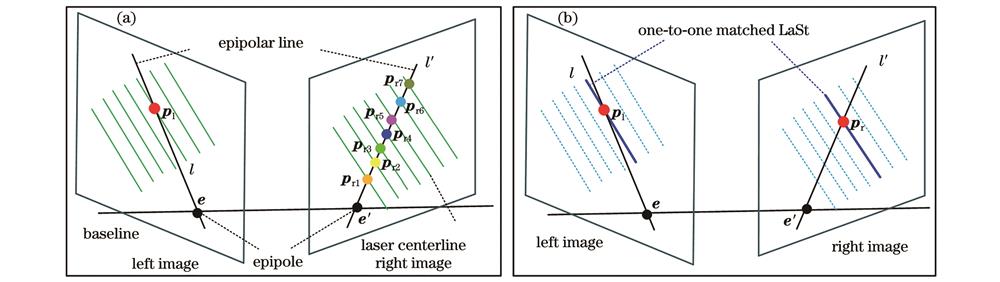
    Fig. 1. Comparison of laser point matching methods. (a) Matching based on epipolar constraint; (b) proposed matching method
    BMLL 3D reconstruction process. (a) BMLL 3D reconstruction system; (b) laser line image; (c) single-frame reconstruction result
    Fig. 2. BMLL 3D reconstruction process. (a) BMLL 3D reconstruction system; (b) laser line image; (c) single-frame reconstruction result
    Diagram of registration process in BMLL 3D reconstruction system. (a) BMLL 3D reconstruction system; (b) global marker point library construction; (c) local view reconstruction and global registration
    Fig. 3. Diagram of registration process in BMLL 3D reconstruction system. (a) BMLL 3D reconstruction system; (b) global marker point library construction; (c) local view reconstruction and global registration
    Schematic diagram of LaSt matching algorithm flow
    Fig. 4. Schematic diagram of LaSt matching algorithm flow
    Linear calibration diagrams. (a) LaSt image; (b) LaSt centerline extraction; (c) LaSt center point classification
    Fig. 5. Linear calibration diagrams. (a) LaSt image; (b) LaSt centerline extraction; (c) LaSt center point classification
    Example of matching of left LaSt and right LaSt. (a) Left LaSt image; (b) left LaSt line fitting; (c) right LaSt image; (d) right LaSt line fitting
    Fig. 6. Example of matching of left LaSt and right LaSt. (a) Left LaSt image; (b) left LaSt line fitting; (c) right LaSt image; (d) right LaSt line fitting
    Schematic diagrams of laser plane calibration. (a) Laser point reconstruction results; (b) laser plane fitting results
    Fig. 7. Schematic diagrams of laser plane calibration. (a) Laser point reconstruction results; (b) laser plane fitting results
    Diagrams of RC characteristics. (a) Distribution of LaSt within degree-of-freedom (DoF) range; (b) spatial correspondence of laser points in two views
    Fig. 8. Diagrams of RC characteristics. (a) Distribution of LaSt within degree-of-freedom (DoF) range; (b) spatial correspondence of laser points in two views
    Diagram of coarse matching process. (a) Left image; (b) right image; (c) rectangular boxes centered at pli and pr,p(ik) in right image; (d) unique correct matching point in polygon
    Fig. 9. Diagram of coarse matching process. (a) Left image; (b) right image; (c) rectangular boxes centered at pli and pr,p(ik) in right image; (d) unique correct matching point in polygon
    Reverse matching diangrams. (a) LaSt and centerline images; (b) laser point classification results; (c) forward matching results; (d) reverse matching results
    Fig. 10. Reverse matching diangrams. (a) LaSt and centerline images; (b) laser point classification results; (c) forward matching results; (d) reverse matching results
    Experimental device and tested objects. (a) BMLL 3D reconstruction system; (b) partial experimental objects I; (c) partial experimental objects II; (d) plane calibration plate; (e) circular calibration plate
    Fig. 11. Experimental device and tested objects. (a) BMLL 3D reconstruction system; (b) partial experimental objects I; (c) partial experimental objects II; (d) plane calibration plate; (e) circular calibration plate
    Comparative experimental results of different LaSt. (a) Continuous variation; (b) monotonic variation; (c) non-monotonic variation
    Fig. 12. Comparative experimental results of different LaSt. (a) Continuous variation; (b) monotonic variation; (c) non-monotonic variation
    Reconstruction results of LaSt with different matching methods. (a) Continuous variation; (b) monotonic variation; (c) non-monotonic variation
    Fig. 13. Reconstruction results of LaSt with different matching methods. (a) Continuous variation; (b) monotonic variation; (c) non-monotonic variation
    Comparison of results of laser point matching
    Fig. 14. Comparison of results of laser point matching
    Measurement results of standard spheres. (a) Standard sphere device; (b) single reconstruction and fitting results; (c) reconstruction error of 3D sphere model; (d) sphere center distance
    Fig. 15. Measurement results of standard spheres. (a) Standard sphere device; (b) single reconstruction and fitting results; (c) reconstruction error of 3D sphere model; (d) sphere center distance
    Matching results of LaSt in experimental scenario 1. (a) Scene 1; (b) reconstruction results; (c) LaSt and centerline; (d) classification results of laser points; (e) matching results
    Fig. 16. Matching results of LaSt in experimental scenario 1. (a) Scene 1; (b) reconstruction results; (c) LaSt and centerline; (d) classification results of laser points; (e) matching results
    Matching results of LaSt in experimental scenario 2. (a) Scene 2; (b) reconstruction results; (c) LaSt and centerline; (d) classification results of laser points; (e) matching results
    Fig. 17. Matching results of LaSt in experimental scenario 2. (a) Scene 2; (b) reconstruction results; (c) LaSt and centerline; (d) classification results of laser points; (e) matching results
    Experimental results for 1.3 million pixel camera and 8 mm lens. (a) Hardware configuration 1; (b) reconstruction results; (c) LaSt and centerline; (d) classification results of laser points; (e) matching results
    Fig. 18. Experimental results for 1.3 million pixel camera and 8 mm lens. (a) Hardware configuration 1; (b) reconstruction results; (c) LaSt and centerline; (d) classification results of laser points; (e) matching results
    Experimental results for 5 million pixel camera and 12 mm lens. (a) Hardware configuration 2; (b) reconstruction results; (c) LaSt and centerline; (d) classification results of laser points; (e) matching results
    Fig. 19. Experimental results for 5 million pixel camera and 12 mm lens. (a) Hardware configuration 2; (b) reconstruction results; (c) LaSt and centerline; (d) classification results of laser points; (e) matching results
    Item metric

    fM‑AcR for continuous change

    (total: 87)

    fM‑ReR for

    continuous change (total: 87)

    fM‑AcR for

    monotonic change (total: 336)

    fM‑ReR for

    monotonic change (total: 336)

    fM‑AcR for

    non‑monotonicchange(total: 396)

    fM‑ReR for

    non‑monotonicchange (total: 396)

    Average of fM‑AcR

    (total: 819)

    Averageof fM‑ReR

    (total: 819)

    SeC100.00087.92985.11957.33980.30356.36488.47467.211
    LtG100.00087.92991.36961.49187.87963.05093.08370.823
    CtF100.00087.92992.85774.69891.16273.86594.67373.831
    Ours100.00087.92998.51279.23997.72777.63098.74681.599
    Table 1. LaSt matching effect of different methods
    ModuleMCEMCRTMCLCELSMLSRTotal
    Time consumed /ms26.4345.9523.9807.6876.4185.60856.079
    Table 2. Time consumption of each module
    Lei Deng, Guihua Liu, Huiming Huang, Hao Deng, Wei Rao, Tianci Liu. Stereo Matching of Binocular Multi-Line Laser Stripes Based on Regional Consistency and Voting Scoring Mechanism[J]. Acta Optica Sinica, 2025, 45(5): 0515002
    Download Citation