• Chinese Optics Letters
  • Vol. 22, Issue 10, 103401 (2024)
Zichen Gao1, Yajun Tong2, Yueran Wang1, Xinyuan Wang1..., Pingping Wen1, Donghao Lu1, Xinye Yuan1, Difei Zhang1, Jingcheng Xiao1, Xiaokai Li2, Zhihao Guan2, Jiacheng Gu2, Yonggan Nie2, Zhi Guo3, Zhen Wang3, Chao Feng3, Jiadong Fan2,* and Huaidong Jiang1,2,**|Show fewer author(s)
Author Affiliations
  • 1School of Physical Science and Technology, ShanghaiTech University, Shanghai 201210, China
  • 2Center for Transformative Science, ShanghaiTech University, Shanghai 201210, China
  • 3Shanghai Advanced Research Institute, Chinese Academy of Sciences, Shanghai 201210, China
  • show less
    DOI: 10.3788/COL202422.103401 Cite this Article Set citation alerts
    Zichen Gao, Yajun Tong, Yueran Wang, Xinyuan Wang, Pingping Wen, Donghao Lu, Xinye Yuan, Difei Zhang, Jingcheng Xiao, Xiaokai Li, Zhihao Guan, Jiacheng Gu, Yonggan Nie, Zhi Guo, Zhen Wang, Chao Feng, Jiadong Fan, Huaidong Jiang, "Characterization of single-pulse photon energy and photon energy jitter at the Shanghai soft X-ray Free-Electron Laser," Chin. Opt. Lett. 22, 103401 (2024) Copy Citation Text show less
    Schematic of the light path. The XFEL beam is focused on the sample using the K-B mirror and cleaned by slits. The sample is a pinhole with a diameter of d, L is the distance from the sample to the detector. Three sets of pinhole diffraction data were collected, named experiment 1/2/3, by moving the detector by 10 cm, twice as close to the sample.
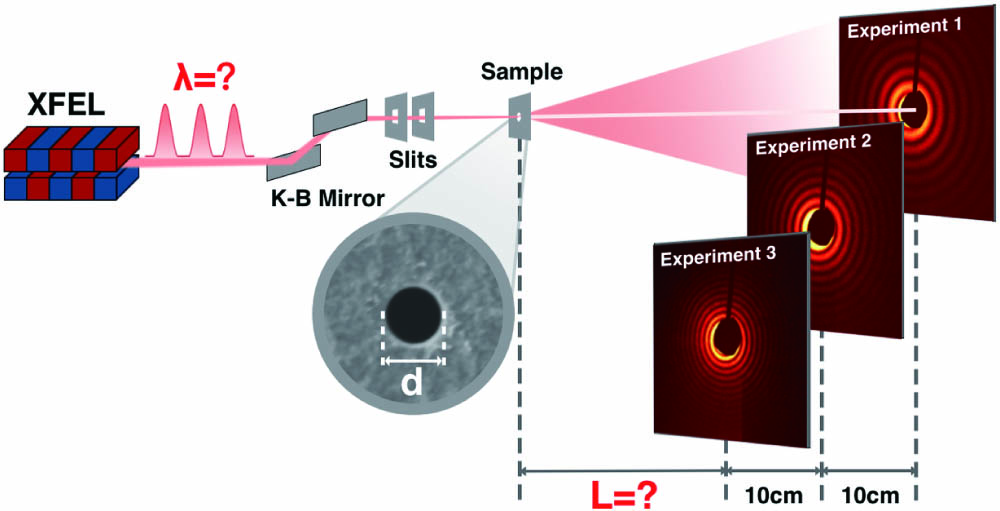
    Fig. 1. Schematic of the light path. The XFEL beam is focused on the sample using the K-B mirror and cleaned by slits. The sample is a pinhole with a diameter of d, L is the distance from the sample to the detector. Three sets of pinhole diffraction data were collected, named experiment 1/2/3, by moving the detector by 10 cm, twice as close to the sample.
    Experimental samples and patterns. (a) The sample is a pinhole. The pinhole effective diameter at the light incident side is 1.025 µm. (b)–(d) Three typical diffraction patterns at positions 1, 2, and 3, respectively. Owing to the beam stop, the central diffraction signal was missing. Patterns 1, 2, and 3 correspond to sample-to-detector distances of L + 20 cm, L + 10 cm, and L, respectively. Patterns display 1000 × 1000 pixels with a pixel size of 15 µm. (e) PSD of pattern 1/2/3. The kth diffraction peak is denoted as ωk, and the peak spacing between the (k−1)th and kth diffraction peaks is denoted as ωk−1→k.
    Fig. 2. Experimental samples and patterns. (a) The sample is a pinhole. The pinhole effective diameter at the light incident side is 1.025 µm. (b)–(d) Three typical diffraction patterns at positions 1, 2, and 3, respectively. Owing to the beam stop, the central diffraction signal was missing. Patterns 1, 2, and 3 correspond to sample-to-detector distances of L + 20 cm, L + 10 cm, and L, respectively. Patterns display 1000 × 1000 pixels with a pixel size of 15 µm. (e) PSD of pattern 1/2/3. The kth diffraction peak is denoted as ωk, and the peak spacing between the (k−1)th and kth diffraction peaks is denoted as ωk−1→k.
    Fitting of average peak periods ωk−1→k to sample-to-detector distance and single-pulse photon energy statistics. A total of 61 diffraction patterns with high SNR were selected. (a) Linear fitting of ωk−1→k to sample-to-detector distance. The gray dashed line represents the fitting result, and the slope provides the average wavelength λ = 3.05 ± 0.01 nm, while the intercept gives the sample-to-detector distance L = 16.61 ± 0.03 cm. (b) Single-pulse photon energy statistics. The photon energy for all 61 pulses is shown, where blue, orange, and green correspond to experiments 1/2/3, respectively. The gray dashed line represents the average photon energy of 406.5 eV.
    Fig. 3. Fitting of average peak periods ωk−1→k to sample-to-detector distance and single-pulse photon energy statistics. A total of 61 diffraction patterns with high SNR were selected. (a) Linear fitting of ωk−1→k to sample-to-detector distance. The gray dashed line represents the fitting result, and the slope provides the average wavelength λ = 3.05 ± 0.01 nm, while the intercept gives the sample-to-detector distance L = 16.61 ± 0.03 cm. (b) Single-pulse photon energy statistics. The photon energy for all 61 pulses is shown, where blue, orange, and green correspond to experiments 1/2/3, respectively. The gray dashed line represents the average photon energy of 406.5 eV.
    XAS and spectrometer results. (a) The XAS profile of a 600 nm-thick Si3N4 window is represented by the red line, and the reference spectrum is shown in blue from Ref. [38]. X-ray absorption has been converted to normalized optical density. (b) Spectrometer measurement results. The curve represents the normalized pulse photon energy distribution, and the histogram represents the normalized mean photon energy statistics.
    Fig. 4. XAS and spectrometer results. (a) The XAS profile of a 600 nm-thick Si3N4 window is represented by the red line, and the reference spectrum is shown in blue from Ref. [38]. X-ray absorption has been converted to normalized optical density. (b) Spectrometer measurement results. The curve represents the normalized pulse photon energy distribution, and the histogram represents the normalized mean photon energy statistics.
    Experiment number123456789101112
    Mean photon energy E¯ (eV)381.9384.8387.8390.2392.7398.1400.9403.3404.8408.6411.0414.8
    Photon energy jitter ξE (eV)0.830.920.820.950.780.760.850.830.480.920.400.73
    Table 1. Spectrometer Results
    Zichen Gao, Yajun Tong, Yueran Wang, Xinyuan Wang, Pingping Wen, Donghao Lu, Xinye Yuan, Difei Zhang, Jingcheng Xiao, Xiaokai Li, Zhihao Guan, Jiacheng Gu, Yonggan Nie, Zhi Guo, Zhen Wang, Chao Feng, Jiadong Fan, Huaidong Jiang, "Characterization of single-pulse photon energy and photon energy jitter at the Shanghai soft X-ray Free-Electron Laser," Chin. Opt. Lett. 22, 103401 (2024)
    Download Citation